Mid-Caps & Transportation Show Upside Targets For Next Rally
An important technical conclusion stemming from the recent volatility spike is that prices must continue to push higher, above previous highs, in order to confirm the continued upside price expectations. The recent volatility spike and downside rotation in the US major stock market were big enough to reset many trending systems and prompt new upside price targets. In this research article, I will share our targets on the Mid-Caps and the Transportation ETFs to show you want we expect from the potential rally.
IWM Breakout Above $218.35 Suggests Rally Is Just Starting
The IWM, the Ishares Russell 2000 ETF, Daily chart highlights the recent rotation in price and shows a Fibonacci price extension range from the late December 2020 lows to the recent late January 2021 highs. I use these Fibonacci price extensions as a means of measuring potential upside or downside price targets, which seem to be fairly accurate. Watching what happens near the 61.8% level on the chart will guide us in determining if the 100% target level will be reached quickly or after a bit of consolidation.
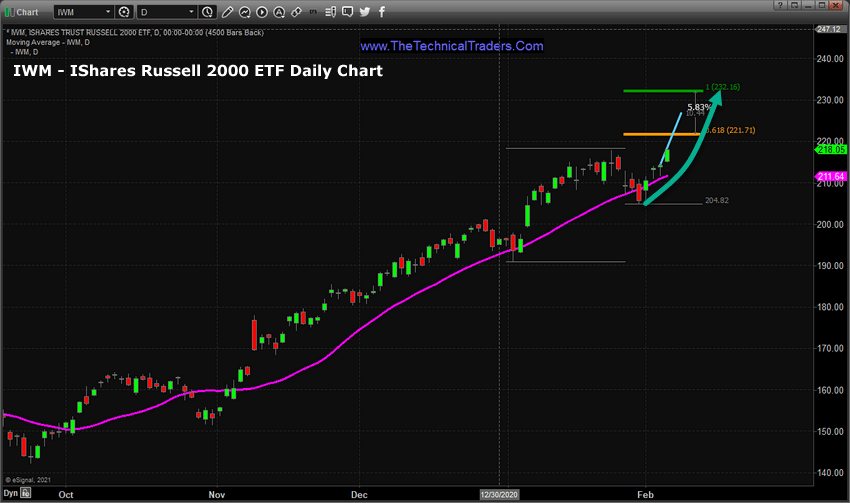
For example, the upside 61.8% target on this IWM chart is $221.71. Once price breaches this level by rallying higher, and if price rallies through this level strongly, then we would expect the rally to continue towards the 100% target level. If price rallies up to the 61.8% level and stalls or pulls away from that level then we would expect price to continue to stall in an attempt to build a new momentum base before possibly rallying higher towards the 100% level at some point in the future.
Therefore, there are really three critical levels on this chart, the late January previous highs, near $218.35 (which have been breached today), $221.71 (the 61.8% Fibonacci target level), and $232.16 (the 100% Fibonacci target level). The current breakout above the $218.35 level suggests this new upside price rally has enough momentum to continue higher and attempt to target the $221.71 level. This is technical confirmation of the bullish trend and puts the upside price targets clearly in play.
Transports Show Upside Targets Hinge On The $232.90 Level
The IYT, IShares Transportation Average ETF, Daily chart below shows the recent bottom and upside price rally has yet to breach the recent January 2021 highs, near $232.90. As we saw the Russell 2000 (IWM) chart, above, has already broken recent highs, it is important that we see the IYT also break through recent highs to confirm the strength and momentum of this trend.
Be sure to sign up for our free market trend analysis and signals now so you don’t miss our next special report!
At this point we expect the IYT to continue to push higher, targeting the $232.90 level, attempt to break above this level, then begin to move higher targeting the $237.27 (61.8% Fibonacci target level) and then $252.32 (100% Fibonacci target level).
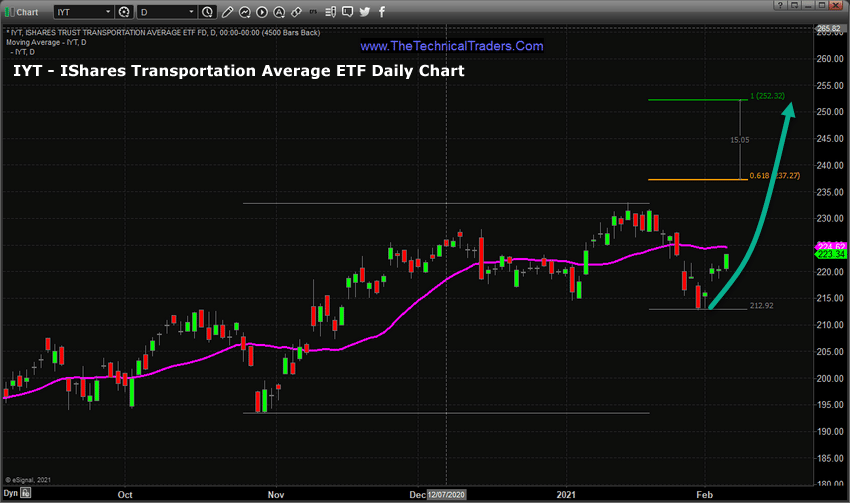
The deeper downside rotation in this IYT chart shows how strong the Mid-Cap sector is compared to the Transportation sector. Mid-Caps and Small-Caps are really seeing a very strong momentum move while the Transportation sector has a much bigger range to recover and break above. It is not that we don’t believe the Transportation sector won’t rally higher, it just highlights the focus of traders is in the Mid-Caps and Small-Caps at this stage of the rally.
As traders begin to realize the upward price potential as they watch this rally momentum build, we believe a shift in thinking will take place. Once multiple sector averages break above recent highs and the Transportation Average breaks higher, then a broad sector confirmation of this renewed rally phase will drive traders back into the markets. As some sectors fail, others will begin to trend higher. We watch these sectors to determine what are the best sectors to trade based on relative strength and momentum and then trade their respective ETFs. I call this my Best Asset Now, or BAN, strategy.
My subscribers and I are loving the strategy – we took out three ETF trades in the three hottest sectors and one Index trade and all are moving up nicely after only 2.5 days. We hit our 7%, 15%, and 20% targets for one of our trades within 48 hours, and continue to ride the remainder of our position in that trade up until we are stopped out! This is how we make money while still getting that awesome, excitable feeling from being in an explosive, possibly parabolic, trade!!
Don’t miss the opportunities in the broad market sectors over the next 6+ months, which will be an incredible year for traders of the BAN strategy. You can sign up now for my FREE webinar that teaches you how to find, enter, and profit from only those sectors that have the most strength and momentum. Learn how the BAN strategy can help you spot the best trade setups because staying ahead of sector trends is going to be key to success in volatile markets.
For those who believe in the power of trading on relative strength, market cycles, and momentum but don’t have the time to do the research every day then my BAN Trader Pro newsletter service does all the work for you with daily market reports, research, and trade alerts. More frequent or experienced traders have been killing it trading options, ETFs, and stocks using my BAN Hotlist ranking the hottest ETFs, which is updated daily for my premium subscribers.
Happy trading!
Chris Vermeulen
Chief Market Strategist
www.TheTechnicalTraders.com