Platinum Begins Big Breakout Rally
If you were not paying attention, Platinum began to rally much higher over the past 3+ days – initiating a new breakout rally and pushing well above the $1250 level. What you may not have noticed with this breakout move is that commodities are hot – and inflation is starting to heat up. What does that mean for investors/traders?
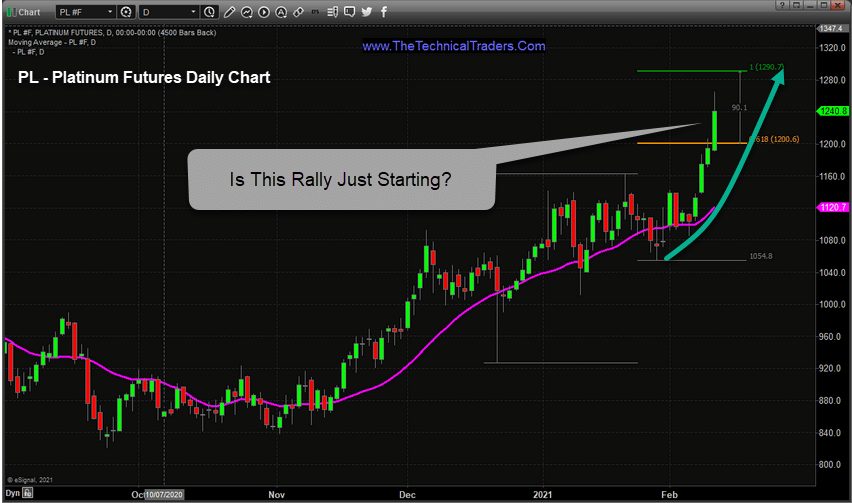
Daily Platinum Chart Shows Clear Breakout Trend
First, Platinum is used in various forms for industrial and manufacturing, as well as jewelry and numismatic functions (minting/collecting). This move in Platinum is more likely related to the increasing inflationary pressures we’ve seen in the Commodity sector coupled with the increasing demand from the surging global economy (nearing a post-COVID-19 recovery). The most important aspect of this move is the upward pricing pressure that will translate into Gold, Silver, and Palladium.
We’ve long suggested that Platinum would likely lead a rally in precious metals and that a breakout move in platinum could prompt a broader uptrend in other precious metals. Now, the combination of this type of rally in Platinum combined with the Commodity rally and the inflationary pressures suggests the global markets could be in for a wild ride over the next 12 to 24+ months.
This Daily Platinum chart highlights the recent upside breakout rally that has prompted a rally from $1050 to $1250+. If this rally continues to target the 100% Fibonacci price extension, near $1300, then it will become very clear that Platinum is rallying away from other precious metals. If this coincides with a continued general Commodity price rally, then we may start to see an inflationary cycle setting up that really change things – very quickly.
This type of “triple-whammy” is very similar to the commodity/inflationary price rally that took place in the late 1970s and early 1980s. For those of you that don’t remember this trend, commodities started to rally in the early/min-1970s, prompting Gold to rally a low price near $100 (in 1976) to a higher level near $195 (in 1978) – but that was just the beginning. After that rally stalled a bit, a bigger commodity price rally took place in 1979 that prompted a much bigger Gold price rally and started an inflationary price cycle that prompted the US Fed to take aggressive action in curtailing inflation. Gold rallied from $169 in late 1978 to over $870 in early 1980 – a 420% increase.
Platinum May Lead A Commodity Price Rally
We believe the rally in Platinum is a strong signal that a Commodity price rally is initiating and that an inflationary price cycle may be starting. If our research is correct, evidence of this cycle phase will continue over the next 6+ months where commodities will continue to rally overall and where market inflation will become very tangible in the US and across the globe. This will prompt the US Fed, and global central banks, to begin to take immediate action to contain any potential run-away inflation concerns – obviously tightening monetary policy and raising interest rates.
Be sure to sign up for our free market trend analysis and signals now so you don’t miss our next special report!
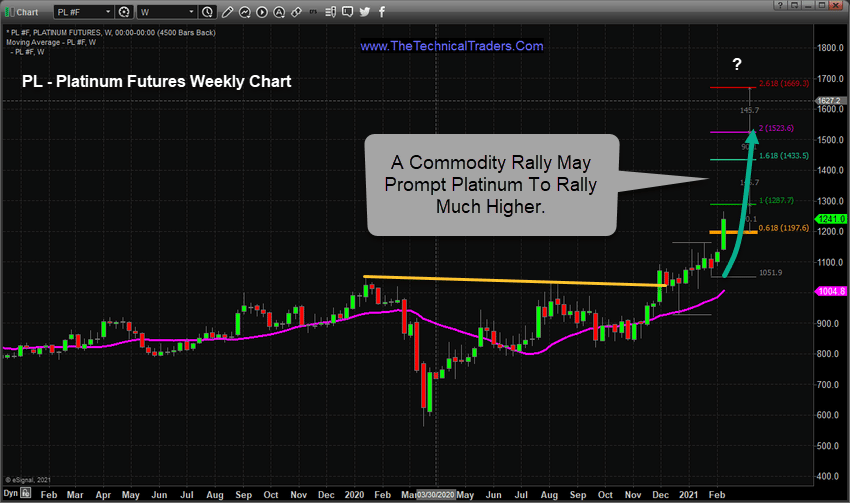
Platinum may rally above $1500 if this rally extends to the 200% Fibonacci price extension level – and that move may come very quickly. This weekly Platinum chart, below, shows a green arrow that points to the 200% Fibonacci price extension level (near $1500). Remember, the commodity price rally in 1979/1980 lasted more than 24 months and prompted a big 400%+ rally in Gold. If that type of rally were to happen today, Gold would rally to levels near $7500 (or higher).
Pay attention to what is happening with Platinum and you’ll start to understand the inflationary/institutional demand for this unique metal. If our research is correct, we may see a new rally in Gold and Silver fairly quickly as Platinum acts as a catalyst for an inflationary cycle paired with a Commodity rally (very similar to the 1979 to 1980 rally).
It is a great time to be an active trader in these markets. One of our recent BAN trades just closed out for a 47% gain. These big trends may be here for the next 24+ months and 2021 is going to be full of these types of trends and setups. Quite literally, hundreds of these setups and trades will be generated over the next 3 to 6 months using the BAN Trader Pro technology. The BAN Trader Pro technology does all the work for us.
Don’t miss the opportunities in the broad market sectors over the next 6+ months, which will be an incredible year for traders of the BAN strategy. You can sign up now for my FREE webinar that teaches you how to find, enter, and profit from only those sectors that have the most strength and momentum. Learn how the BAN strategy can help you spot the best trade setups because staying ahead of sector trends is going to be key to success in volatile markets.
For those who believe in the power of trading on relative strength, market cycles, and momentum but don’t have the time to do the research every day then my BAN Trader Pro newsletter service does all the work for you with daily market reports, research, and trade alerts. More frequent or experienced traders have been killing it trading options, ETFs, and stocks using my BAN Hotlist ranking the hottest ETFs, which is updated daily for my premium subscribers.
Have a great day!
Chris Vermeulen
Chief Market Strategist
www.TheTechnicalTraders.com