How To Spot Boom and Bust Cycles
One of the most important aspects of trading is being able to properly identify major market cycles and trends. The markets will typically move between four separate stages: Bottoming/Basing, Rallying, Topping/Distribution, and Bearish Trending. Each of these phases of market trends is often associated with various degrees of market segment trending as well. For example, one of the most telling phrases of when the stock market is nearing an eventual Topping/Distribution phase is when the housing market gets super-heated. Yet, one of the most difficult aspects of this Excess Phase rally trend is that it can last many months or years, and usually longer than many people expect.
Until Gold Really Starts To Rally, Expect A Continued Rally In The Stock Market
When an Excess Phase rally is taking place in the stock market, we expect to see the Lumber vs. Gold ratio moving higher and typically see the RSI indicator stay above 50. Demand for lumber, a commodity necessary for building, remodeling, and other consumer essential spending, translates well as an economic barometer for big-ticket consumer spending. Extreme peaks in this ratio can often warn of a pending shift in consumer spending and how the stock market reacts to an Excess Phase Peak. Let’s take a look at some of the historical reference points on this longer-term Weekly Lumber vs. Gold chart below.
First, the 1992 to 2005 ratio levels represent a moderately low Gold price level compared to a somewhat inflated Lumber price level. You can see how that dramatically changed between 2005 and 2012 – this was a time when Gold started a historic rally phase just before the Housing/Credit crisis of 2008-09.
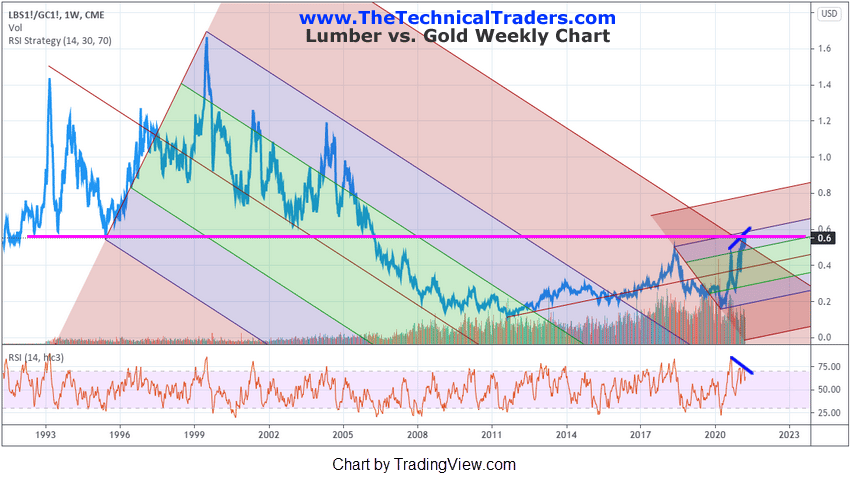
Since that time, the Lumber to Gold ratio has stayed below historical low reference points (near 0.6). This shift in the Lumber to Gold ratio suggests that demand for Gold outpaced demand for Lumber over the past 10+ years. Now, the Lumber to Gold ratio is climbing back to levels near or above that 0.6 level and may soon move higher if the post-COVID economic recovery continues while demand for Gold stays somewhat muted.
Traders need to pay attention to this current rally in the Lumber vs. Gold ratio because a breakout rally above the 0.60 level would likely mean a continued rally phase for the US stock market and strong sector trending related to consumer spending, housing, and speculative sectors. Whereas, a failure to rally above the 0.60 level at this stage may indicate that the US stock market will begin to stall and potentially move into a sideways correction before starting a new trend.
Be sure to sign up for our free market trend analysis and signals now
so you don’t miss our next special report!
Lastly, we have drawn some Std Deviation channels on this longer-term Lumber to Gold Weekly chart above. It is very important to understand that a continued rally in the Lumber to Gold ratio will break above the upper downward sloping channel from the 1999 peak and potentially prompt a big upside price rally – likely pushing the US stock market to extended new highs.
A Closer Look At The Current Setup
When we zoom into the current price trends on the following Lumber to Gold ratio chart below, we can clearly see the two recent rally trends; the first after the 2016 US elections and the second after the COVID-19 bottom. The most important aspect of this chart right now is that any continued rally in the Lumber to Gold ratio may quickly breach the 0.60 historical range and potentially prompt a very big rally in the US stock market over the next few months.
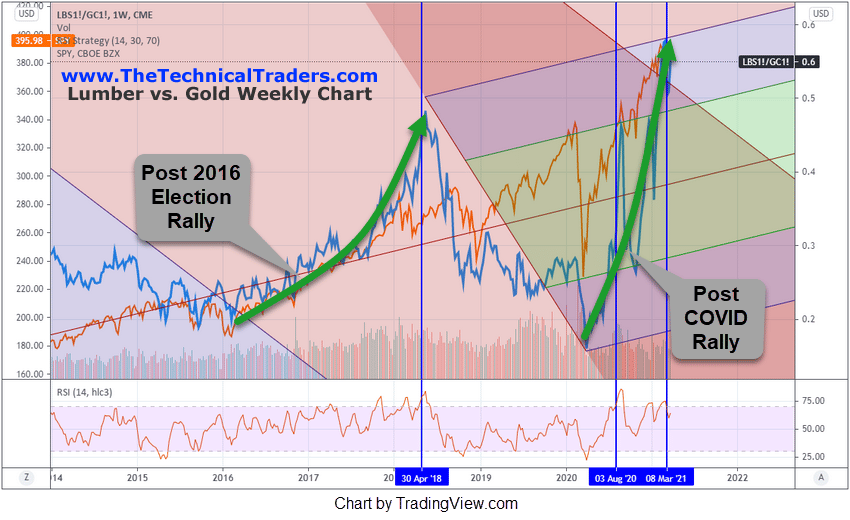
The new COVID stimulus and the continued efforts to pass an Infrastructure Bill in the US Congress may prompt enough of a capital injection into the US economy to set off a “booster phase” rally at this stage in the economic recovery. One simply can’t rely on the fact that the Lumber to Gold ratio is near a historically critical level, we need to actually wait to see confirmation of a breakdown in this trend before we can say what is likely to happen in the near future. If the ratio climbs above 0.60 and continues to rally higher, then it is very likely that the US and Global stock market trends will also continue much higher.
Historical Peaks & Rallies – When To Be Concerned
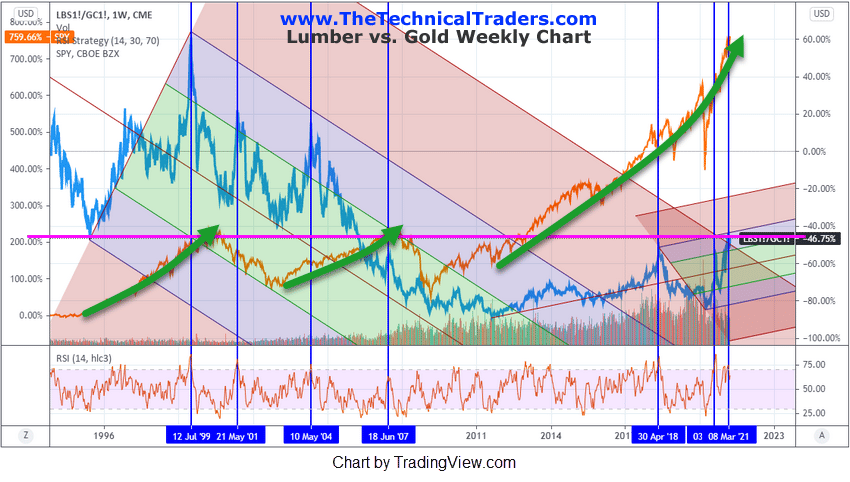
This longer-term Lumber to Gold ratio chart shows how the SPY continued to rally through various stages of the rally in the ratio level. We also have to remember the peak in 2000 was related to two important economic events; the DOT COM bubble burst and the 9/11 terrorist attacks. Subsequently, the breakdown in the Lumber to Gold ratio that started in 2004 was related to a broadly weakening housing market trend – prompted by an ever-increasing Fed Funds Rate which began in 2004-05. Currently, we have the US Fed promising “near-zero” rates through 2022 and an easy money policy throughout that time to support stronger global market recovery. Barring any unforeseen credit, economic, or global market event, we believe a breakout rally in the Lumber to Gold ratio, assuming Gold stays below $2250 and does not enter a breakout rally phase, will coincide with a moderately strong US stock market rally.
When should you start to be concerned that a top is setting up based on this ratio?
Very simply put, when you see Gold start to rally above $2150~$2250 and breakout into a true rally while the price of Lumber begins to fall somewhat sharply, then we believe traders should start to actively protect positions and prepare for a bigger breakdown in the stock market trend. Until Gold starts to react as a proper hedge, this speculative “excess phase” rally will likely continue higher.
As a warning for all our friends and followers, a breakdown of this upside rally trend could be sudden if a major market event takes place. For example, if a sudden collapse in the credit/debt markets were to happen (related to risk exposure or bank/financial firm failures), then we may see a very sudden breakdown in this ratio. Additionally, if war or geopolitical economic tensions break out where excessive global risks become a factor, then we may also see this ratio turn negative quickly.
Traders need to understand the potential for a continued stock market rally near these current levels is quite strong, but there are still risks of a sudden breakdown in trending. The question that nobody can answer is “what will the catalyst event be and when could it happen?”. Until then, trade the hottest sectors using my Best Asset Now strategy, which you can learn NOW by signing up for my FREE webinar that will teach you how to find the best sectors to trade.
Until the end of the trend is upon us, get ready for some really interesting global market trends and sector opportunities. It is very likely that volatility will stay higher than normal prompting 2% to 4%+ rotations in market trends. These next few years are going to be a trader’s dream market in terms of trending and price rotation.
For those who believe in the power of trading sectors that show relative strength and momentum but don’t have the time to do the research every day, let my BAN Trader Pro newsletter service do all the work for you with daily market reports, research, and trade alerts. More frequent or experienced traders have been killing it trading options, ETFs, and stocks using my BAN Hotlist ranking the hottest ETFs, which is updated daily for my BAN Trader Pro subscribers.
Enjoy your Sunday!
Chris Vermeulen
Founder & Chief Market Strategist
www.TheTechnicalTraders.com