Find Out Which ETFs Will Benefit As A Stronger US Dollar Reacts To Global Market Concerns
The recent news of Hedge Fund and other institutional crisis events has opened many eyes as investors and traders realize the post-2008-09 global market credit bubble has extended well beyond what many people may realize. Recent news that China offered a “deferment” for Chinese corporations and state-run enterprises content with shadow banking credit/debt issues at a time when China is tightening monetary policy shows that a process, like the 2008 Lehman incident, may be setting up where institutional level credit/debt liabilities ripple through the global markets as global central banks attempt to reign in monetary policies.
This process is not likely to happen suddenly though. If this type of contraction in global monetary policy takes place, resulting in increased pressures to contain excessive credit/debt functions in the markets, then we believe the process may result in an extended 9 to 16+ months of “hit-and-miss” events leading up to a potentially bigger event. The Archegos Fund forced unwinding of trades hit the markets recently as a wake-up call. Prior to the Archegos event, the Greensill Capital collapse shocked the global markets because of the size and scope of this failure. Now, we see Credit Suisse issuing warnings that Q1 earnings may have taken a big hit because of exposure to the Greensill and Archegos assets – which is leading to Credit Suisse attempting to put the Gupta Trading Unit into insolvency.
As they old saying goes, “shoes are dropping all around us”.
Still, my research team and I believe these incidences are somewhat isolated in today’s world and not of the scale of the 2008-09 credit crisis event but the US Dollar and Treasury Yields are starting to react as if FEAR is starting to increase in the global markets. Let’s start by reviewing what happened to the SPY and US Dollar between 2005 and 2011 to get a better understanding of how these two global market components reacted to the events leading up to the 2008-09 credit market crisis and how the US Dollar acted afterward.
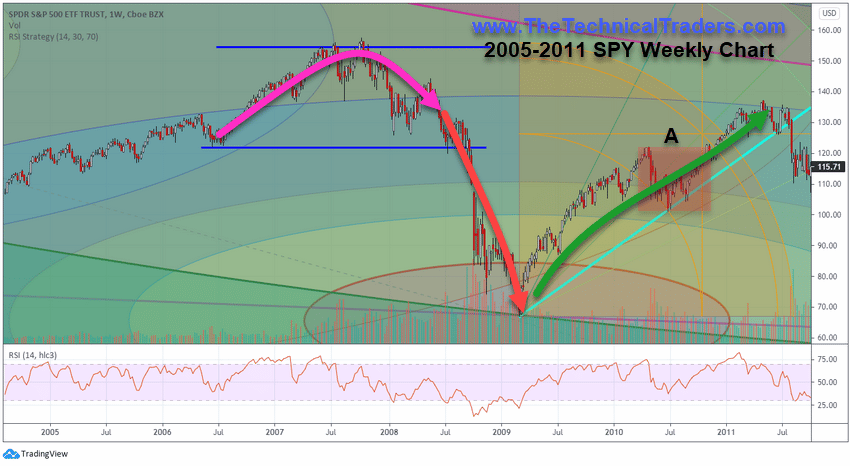
2008-09 Weekly SPY Trends
The following chart shows the SPY Weekly chart data from 2005 to 2011 and highlights the extended “rollover” top that set up between April 2007 and April/May 2008. After that topping pattern was completed, a bigger breakdown in price trend took place in the SPY, near June 2008, which prompted a deep selloff reaching a low in March 2009. Yet, when we compare that activity to the second US Dollar Index Daily chart, we can see the US Dollar didn’t really start to advance until the bigger risks of the 2008 crisis event were becoming clearly evident.

Register here for FREE to join Chris and Neil at the Wealth 365 Summit on April 19-24, 2021
The US Dollar continued to decline through 2007 and extended this decline in early 2008. It bottomed sharply in March 2008 and broke-out to the upside in August 2008. At that same time, the SPY had stalled near $130 – near the end of the “rollover” top formation. The US Dollar reacted to the risks in the markets by firming up near support and actually acting as a global currency safe-haven before the larger risk factors were clearly known.
2008-09 Weekly US Dollar Trends
Throughout the 2008-09 downward price collapse, the US Dollar rallied nearly 26% – reaching a peak just below $90. After that peak was reached, a period of extensive US Dollar volatility continued for many years, ranging from $74 to $89. At that time, the global central banks were manipulating all levers while attempting to navigate the most critical global capital market crisis since 1929. Foreign markets, emerging markets, and global currencies are scrambling for support and traders rolled capital into and out of market sectors, ETF, and stocks chasing recovery returns. Eventually, the US Dollar settled near $80, in 2012-14, then began a strong rally near August 2014 targeting levels above $102.
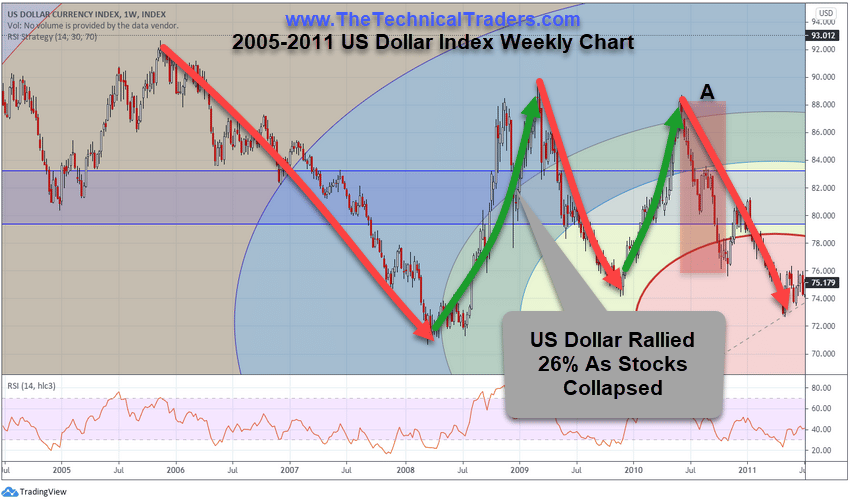
The importance of this historical reference is that the US Dollar begins to act as a global market safe-haven when unknown risk factors begin to rattle global markets. This happens because capital seeks to move away from risks and unhealthy investment environments before the general markets react to these same risks. For example, in the middle of the early recovery after the 2009 bottom, the US Dollar rotated wildly (Highlighted by “A” on these charts). Throughout this price decline and recovery phase, a number of different sectors reacted to the shifting capital and trends that resulted in real opportunities.
- XME – the SPDR Metals & Mining ETF, peaked and sold off from $95 in June 2008 and bottomed near $17.50 in November 2008. Afterward, XME climbed over 345% to a price level above $77 over a 25 month span of time.
- XOP – the SPDR Oil and Gas Exploration ETF, peaked and sold off from $292 in June 2008 and bottomed near $92 in March 2009. Afterward, XOP climbed over 180% to a price level above $260 over a 24 month span of time.
- XHB – the SPDR Homebuilders ETF, peaked and sold off from $25 in September 2008 and bottomed near $8 in March 2009. Afterward, XHB climbed over 150% to a price level above $20 over a 24 month span of time.
Don’t miss the opportunities in the broad market sectors over the next 6+ months. Staying ahead of these sector trends is going to be key to developing continued success in these markets. As some sectors fail, others will begin to trend higher. Learn how BAN Trader Pro can help you spot the best trade setups. Learning to profit from these bigger trends and sector rotation will make a big difference between success and failure. If you are not prepared for these sector rotations, then you can sign up now for my FREE webinar that teaches you how to find, enter, and profit from only those sectors that have the most strength and momentum. Staying ahead of sector trends is going to be key to success in volatile markets.
For those who believe in the power of trading on relative strength, market cycles, and momentum but don’t have the time to do the research every day then my BAN Trader Pro newsletter service does all the work for you with daily market reports, research, and trade alerts. More frequent or experienced traders have been killing it trading options, ETFs, and stocks using my BAN Hotlist ranking the hottest ETFs, which is updated daily for my premium subscribers.
In Part II if this article, we will explore the current US Dollar setup and the sectors we believe will continue to drive strong trends for traders/investors.
Enjoy your Easter Sunday!!
Chris Vermeulen
Founder & Chief Market Strategist
www.TheTechnicalTraders.com