Utilities Continues To Rally – Is It Sending A Warning Signal Yet?
We have experienced an incredible rally in many sectors over the past 5+ months. My research team has been pouring over the charts trying to identify how the next few weeks and months may play out in terms of continued trending or risks of some price volatility setting up. We believe the Utilities Sector may hold the key to understanding how and when the US markets will reach some level of stronger resistance as many sector ETFs are trading in new all-time high price ranges.
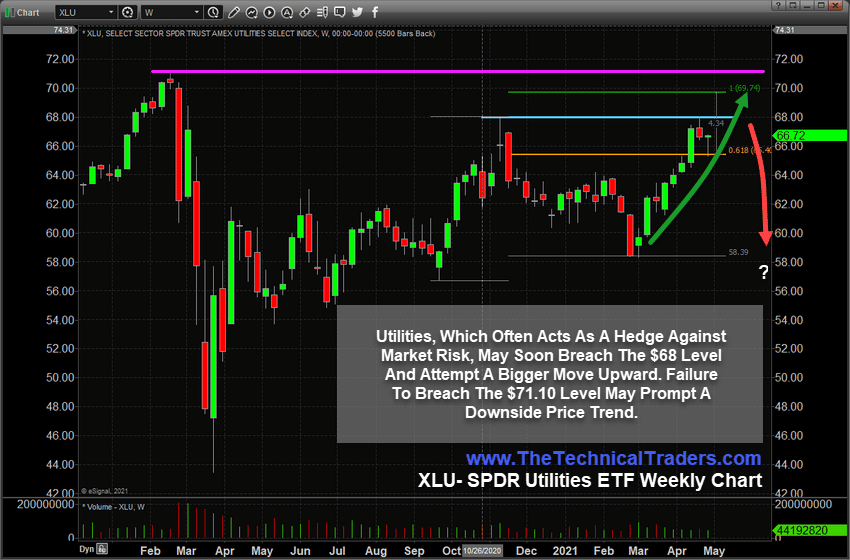
Utilities Sector Resistance At $71.10 Should Not Be Ignored
The Utilities Sector has continued to rally since setting up a unique bottom in late February 2021. A recent double top setup, near $68, suggests resistance exists just above current trading levels. Any continuation of this uptrend over the next few weeks, targeting the $70 Fibonacci 100% Measured Move, would place the XLU price just below the previous pre-COVID-19 highs near $71.10 (the MAGENTA Line).
My research suggests the momentum up this recent uptrend may continue to push prices higher into early May, quite possibly setting up the Utilities ETF for a rally above $70. Yet, we believe the resistance near $71.10 will likely act as a strong barrier for price and may prompt a downward price correction after the completion of the Fibonacci 100% Measured Price Move. In other words, the recent rally across many sectors will likely continue for a bit longer before key resistance levels begin to push many sectors into some sideways trading ranges.
What Goes Straight Up – Typically Comes Crashing Down At Some Point
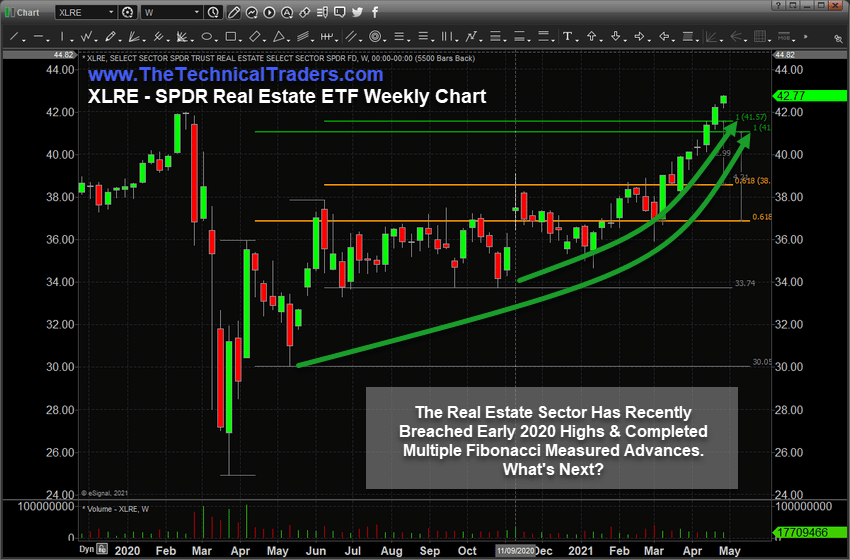
The XLRE Weekly Chart (SPDR Real Estate ETF) highlights the recent rally above the pre-COVID-19 highs, near $42.00, and how the recent rally trend has extended nearly 4+ months after a solid base/bottoming pattern in early 2021. Extended market stimulus and very low interest rates have created a market demand for home purchases that we have not seen in decades. The rally in the Real Estate sector ETFs has pushed price levels just above the pre-COVID-19 highs, a sign that the current rally is extended. We have not seen a measured market pullback in XLRE for almost the entirety of 2021.
Be sure to sign up for our free market trend analysis and signals now so you don’t miss our next special report!
Using our Fibonacci 100% Measured Move technique, we can see that previous price ranges set up Fibonacci 100% Measured Move targets near $41.06 & $41.57. Currently, XLRE has rallied above both of these targets recently and has broken the previous high price level of $42.00, set just before the COVID-19 collapse. We believe this upward price trend has reached a point where an exhaustion pullback may setup as price typically moves in a series of waves within a trend.
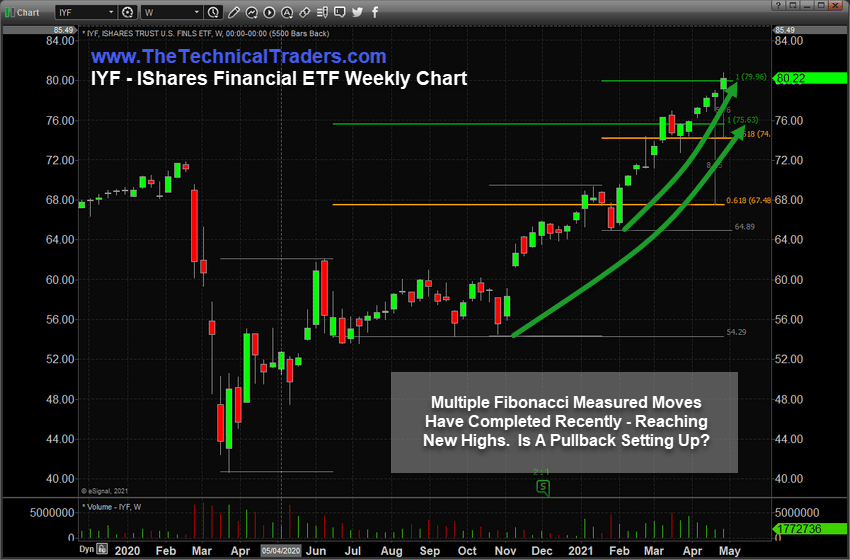
Financial Sector ETF Reaches New Multi-Decade Highs
The Ishares Financial ETF, see the IYF chart below, has reached the highest levels ever recorded since the start of this ETF in 2000. The exuberant rally in this sector, which started just after the November 2020 elections with a large price GAP, has continued to extend higher recently. At this point, the IYF price level has completed two separate Fibonacci 100% Measured Move targets and may push a bit higher before attempting to reach the third Fibonacci Measured Move Target.
Recently, I have published a number of research articles highlighting some of my market analysis suggesting the reflation trade trending may have already reached a “critical mass” in terms of acceleration and momentum. At this point, we believe this momentum will continue pushing price levels higher for a bit longer before key resistance levels begin to shift market trends. You can review some of my previous research entitled Have The Global Markets Already Reached A “Critical Mass” In Terms Of Recovery? and Metals & Miners May Have Started A New Longer-Term Bullish Trend – Part II
The key to understanding and trading market trends is to stay properly positioned and prepared for changes in market trends. We like to use the term “live to trade another day” when we discuss this technique with clients. The recent rallies have shown incredible upward strength and, in some cases, have pushed much higher than the pre-COVID-19 highs.
Many of the strongest sectors over the past 12+ months have already experienced measured price contractions. The Technology, Energy, Oil & Gas, and Biotech have all fallen from the top of our sector ranking strategy, the Best Asset Now (BAN) strategy, and been replaced with other sectors that are strengthening. We feel the global markets are starting to shift again – where capital is actively seeking out new opportunities and/or moving into hedging positions in preparation for increased market volatility.
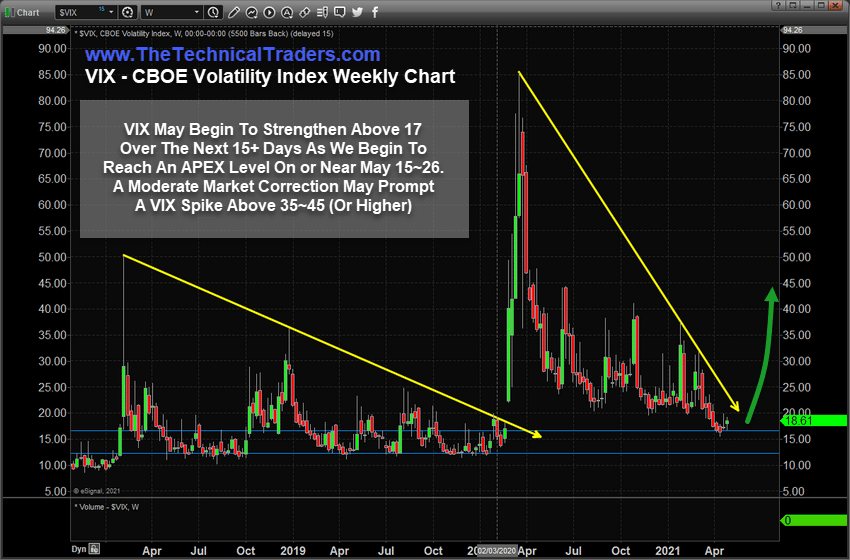
VIX May Spike Before The End Of May 2021 – Be Prepared
We believe these market sectors are starting to show signs that capital is actively shifting away from previous strong trends and actively seeking out more protective investment solutions. This means we may see a spike in the VIX over the next 30+ days and we may also see some extended sideways price trending while the markets shift gears as we move into the early Summer months. This is why we are focusing on the Utilities Sector, Bonds, the US Dollar, and Precious Metals/Miners.
Traders and Investors need to be aware of these sector changes and how new opportunities will setup over the next few days and months. We may continue to see another 10 to 20+ days of bullish trending before these bigger capital shifts become more evident, yet our research team believes this broad market capital shift is already underway.
Staying ahead of these types of sector trends is going to be key to developing continued success in these markets. As some sectors fail, others will begin to trend higher. Learn how BAN strategy can help you spot the best trade setups. You can learn how to find and trade the hottest sectors right now in my FREE course. For those who believe in the power of relative strength, cycles and momentum then the BAN Trader Pro newsletter service does all the work for you in determining what to buy, when to buy it, and how to take profits while minimizing downside risk!
Happy Sunday!
Chris Vermeulen
Chief Market Strategist
www.TheTechnicalTraders.com