VIX and Defensive Sectors React To Perceived Trend Weakness
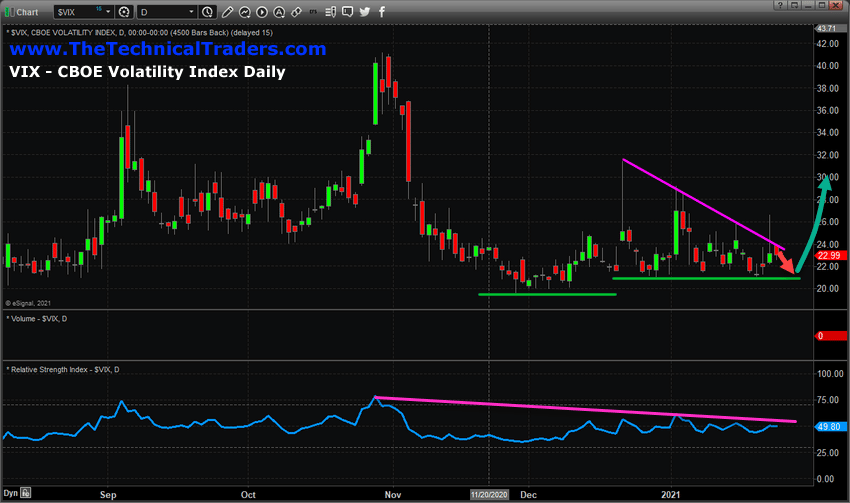
Since early November 2020, the VIX has continued to decline and consolidate near the 22 level. Late in December 2020 and beyond, the VIX started setting up series-high price spikes – which indicates a flagging downside pattern is setting up. You can see this setup across the recent VIX highs drawn in MAGENTA on the chart below. Additionally, the VIX has “stepped” higher – moving from lows near 19.50 to higher lows near 21.00. This upward stepping base is indicative of a shift in volatility.
VIX Sets Up Pennant/Flag Pattern
My research team and I interpret this data as a sign that trend weakness is starting to build after the strong rally that initiated in early November 2020. Although we have not seen any clear sign that the markets are about to reverse or decline, this move in the VIX is suggesting that volatility is increasing. The high price “breakout”, yesterday, in the VIX suggests the MAGENTA flag setup is nearing an Apex/breakout point.
Sector Trends May Shift Suddenly
What continues to interest my team is the continued trend strength in certain sectors and the continued rally attempts in the hottest sectors. For example, electric vehicles, robotics, new innovation, and internet shares are making new all-time highs. This suggests that certain sectors may continue to buck the trend even if the US major indexes enter a period of sideways/downside trading.
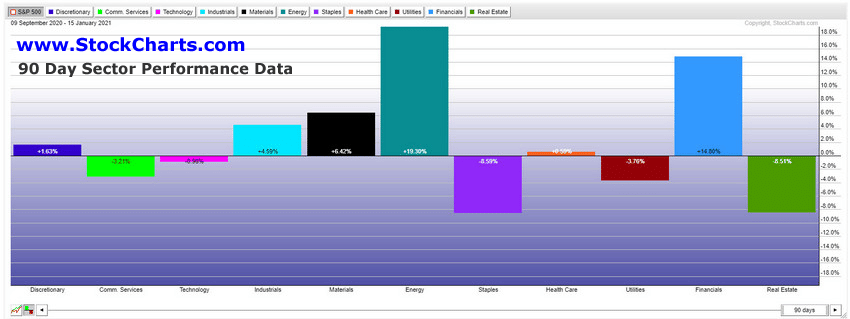
Recently, the strongest major US sectors appear to be Discretionary, Industrials, Materials, Energy, and Financials. If we see Bonds, Utilities, and Precious Metals start to rally while some of these strongest sectors begin to weaken, we would start to become very cautious of any continued rally attempts in the near future. For example, if Energy, Financials, and Transportation start to decline, then we may be starting a shift in how the markets expect this bullish trend to continue.
Be sure to sign up for my FREE webinar that will teach you how to find and trade my BEST ASSET NOW strategy on your own!
Right now, we are seeing the VIX setup a Pennant/Flag formation that appears to be nearing an Apex. Once the Apex is reached, we’ll watch to see how the VIX reacts to any perceived market weakness. Our 2021 Market Predictions research article suggested we may see increased volatility in February/March 2021.
TLT/Bonds Starting To See Some Support
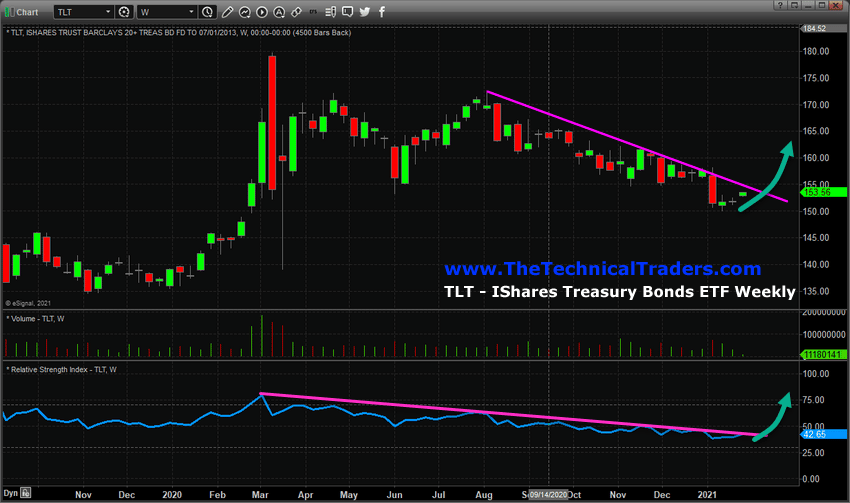
The following TLT (Ishares Treasury/Bonds) ETF Weekly chart highlights the extended downtrend that has taken place since August 2020 (the peak in Gold/Silver). Recent support, although very subtle right now, may be indicative of a pending upside breakout in TLT as we see the VIX chart nearing the Apex of the Flag pattern. My researchers believe early February may see a spike in volatility and prompt certain defensive sectors/symbols to react as a hedge against risks.
Throughout this process, if it takes place, watch for Gold and Silver to decline moderately if the markets suddenly roll-over and start to decline. Precious metals often do not react as a hedge against risks right away. Normally, precious metals decline a bit, as traders suddenly react to the breakdown in trend, then find support and mount an impressive upside price rally. Take a look at the February/March 2020 COVID-19 decline in precious metals to get a better idea of what to expect.
My team and I are watching TLT to see if and when this downward sloping price channel is broken and if the VIX suddenly spikes in alignment with this breakout. If this happens, we may be setting up for a shift in the major markets where weakness drives a moderate downside price trend. 2021 is likely to setup a number of big trends, so there are still ample opportunities for big sector trends and big profits.
Don’t miss the opportunities in the broad market sectors over the next 6+ months. Staying ahead of these sector trends is going to be key to developing continued success in these markets. As some sectors fail, others will begin to trend higher. Learn how my Best Asset Now strategy can help you spot and trade only those sectors that show the greatest relative strength and upward momentum. My BAN strategy has been developed to trade in any bullish or bearish major trend so we can always take advantage of a trend regardless of direction.
We like to share successful trading processes, strategies, and techniques using real trading examples and hope this helps you better understand how to develop efficient trading strategies/rules for your own use. If you want to learn more about my BAN Trader Pro newsletter service, including how to get access to my members’ only daily pre-market video analysis, BAN Hotlist updates, and BAN trade alerts then visit www.TheTechnicalTraders.com/BAN.
Happy Trading!
Chris Vermeulen
Chief Market Strategist
www.TheTechnicalTraders.com