Cannabis, Alternative Agra, Mushrooms, and Cryptos – Everything ALT is HOT – Part II
In the first part of this research article, we explored the Cannabis/Marijuana sector decline (2018 to 2020) and the recent rally/recovery phase as a potential opportunity for traders. Additionally, we reviewed some US Marijuana marketplace data, growth expectations, and other data. The conclusion we came up with after our brief review of this data was that the Cannabis, Marijuana, and Alternative Agriculture sector has been greatly undervalued at or near recent low price levels – many of these stock were trading at levels -75% to -95% below 2017~18 highs.
Our conclusion is that IF this sector continues to grow and enters into a major consolidation phase (where the various specialty firms are acquired by larger industry sector firms – much like what has happened in the Alcoholic-beverage sector), then the Marijuana/Alternative Agriculture sector may become one of the hottest sector plays over the next 3 to 5+ years.
Our researchers believe the recent rally in this sector, prompted by many retail traders (Reddit and others) as well as the recent blow-off top/pullback may be a target for future growth in this sector. Overall, the recent price rally has only started to recover from the 2018 peak to the recent low price range. If our research is correct, and the Cannabis/Alternative Agriculture sector continues to stay in focus with investors, as well as begin to engage in a broad consolidation phase, the recent pullback in price levels may represent an incredible opportunity for future profits. Let’s take a look at some charts.
Aurora Cannabis
The Aurora Cannabis chart below highlights two recent rally phases that promptly pulled back to support levels. The first, in early November 2020, rallied to a high of $14.48 from a low of $3.71 – an incredible 390% rally. Then, prices consolidated near $9.00 before attempting another rally phase targeting the $19.00 level – another incredible 110% rally. Currently, prices have fallen back to levels near $12.50 and we believe a new price consolidation phase will likely take place within the support range we’ve drawn on the chart (below). We also believe another rally attempt will take place prompting a new price high target near $21~22 over the next few weeks (possibly 3 to 6+ weeks). This would represent another 100%+ rally attempt if our research is accurate.
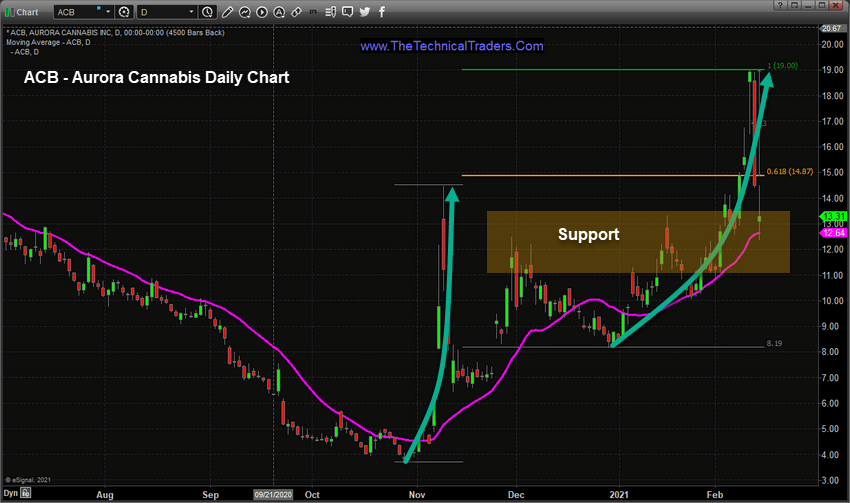
If the support level is broken to the downside, below the $11.00 level, look for additional support near $8.50 to hold and expect a longer momentum/base formation as this sector attempts to hammer out a bottom.
Be sure to sign up for our free market trend analysis and signals now so you don’t miss our next special report!
The following MJ, the Alternative Harvest ETF, Daily chart highlights the same type of rally formation. The rally from late December to the first peak near $21 represented a 48.20% price rally. Then support formed near $18 which prompted the current rally phase – targeting $35. This incredible rally prompted a 74.42% advance before the price immediately reversed and collapsed – attempting to find support and to build another momentum/base.
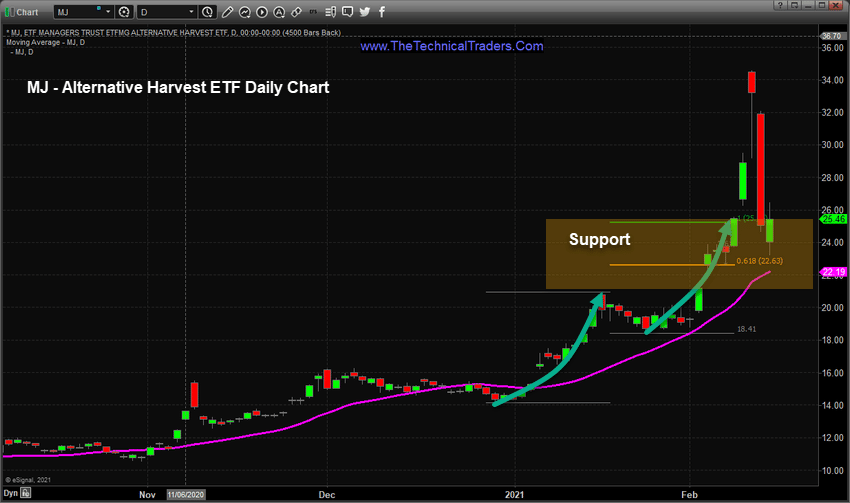
If our research is correct, another rally attempt will likely happen if support between $21 and $25.40 holds – possibly targeting the $36 to $40 price level – representing a 100% to 140% rally. If support is broken to the downside, we believe this sector will attempt to establish a new, lower, momentum base after this big rally phase. So we have to be cautious of where support is currently located and what to expect if price moves lower. Lower support on MJ would be found near $14 to $15.50.
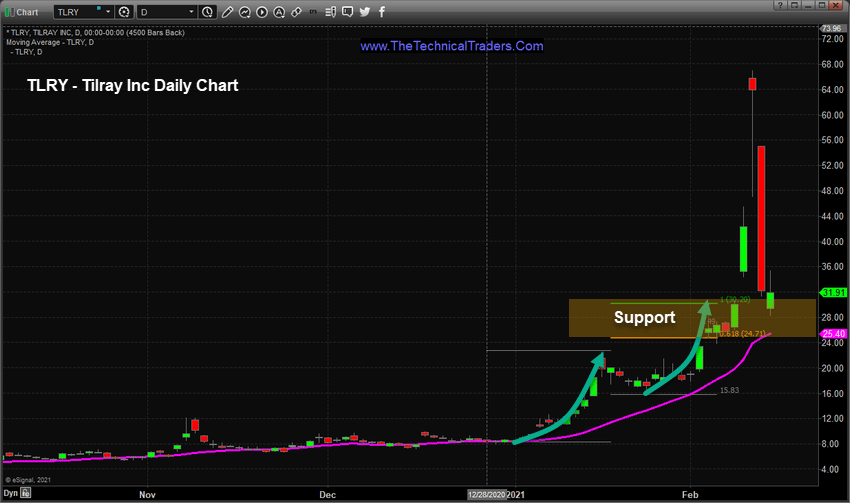
tilray
The Tilray Daily chart, below, shows how identical many of these rallies have been. TLRY looks almost identical to MJ above. Again, support should form a solid momentum/base near $25 to $30 and may likely prompt a rally to levels above $70. Using our preferred Fibonacci 100% expansion range, any rally attempt above $41 to $44 will likely push higher – possibly attempting to break above the $60+ price level.
Remember, any breakdown in price below $25 may be a sign that this sector is attempting to establish lower support after this big rally attempt. So, be aware that recent support must hold in order for another rally phase to attempt new highs again.
We believe there are many opportunities within the Marijuana/Alternative Agriculture sector. Yes, some of these charts have already seen incredible rallies and may not rally as we are expecting. Yet, the overall opportunities within this sector should not be ignored by traders.
The Marijuana and Alternative Agriculture sector is very likely to become one of the most dynamic and opportunistic trades for many traders over the next 5+ years. It currently represents only 10% of the US Alcoholic Beverage marketplace and we believe the opportunities for consumer, medical and pharmaceutical use within the Cannabis sector greatly increases the potential for profits over 5 to 10+ years. This is a sector that is still in it’s infancy compared to the Alcoholic Beverage sector – and has many more diverse use and application capabilities that have yet to be explored and capitalized on.
If our research is correct, we may see another rally attempt in this sector within 4 to 6+ weeks. If our research is wrong, then support levels will be breached as prices attempt to find a new momentum/base level before attempting to move higher again. Either way, we believe the Marijuana/Alternative sector is hot and getting hotter.
Don’t miss the opportunities in the broad market sectors over the next 6+ months. 2021 and beyond are going to be incredible years for traders. Staying ahead of these sector trends is going to be key to developing continued success in these markets. As some sectors fail, others will begin to trend higher. Learn how BAN Trader Pro can help you spot the best trade setups.
I am able to find these trends, like MJ, by using my Best Asset Now strategy. My subscribers and I are loving the strategy as we closed our MJ trade last week after taking profits at the 7,%, 15%, 20%, and 48% levels in two weeks! This is how we make consistent profits from the BAN strategy while still getting that awesome, excitable feeling from being in an explosive trade!!
Don’t miss the opportunities in the broad market sectors over the next 6+ months, which will be an incredible year for traders of the BAN strategy. You can sign up now for my FREE webinar that teaches you how to find, enter, and profit from only those sectors that have the most strength and momentum. Learn how the BAN strategy can help you spot the best trade setups because staying ahead of sector trends is going to be key to success in volatile markets.
For those who believe in the power of trading on relative strength, market cycles, and momentum but don’t have the time to do the research every day then my BAN Trader Pro newsletter service does all the work for you with daily market reports, research, and trade alerts. More frequent or experienced traders have been killing it trading options, ETFs, and stocks using my BAN Hotlist ranking the hottest ETFs, which is updated daily for my premium subscribers.
Enjoy your holiday Monday!
Founder & Chief Market Strategist
www.TheTechnicalTraders.com