Where The SP500 Is Headed Next Week
Everyone wishes they knew where the stock market was going to go next. What sector is going to rally? When is the subsequent market sell-off? When and where to put your money to work are the questions strive to figure out. Nothing is perfect. You cannot predict the future, but if you follow something close enough, you can get a good feeling of where it’s headed next, based on what it has recently been doing.
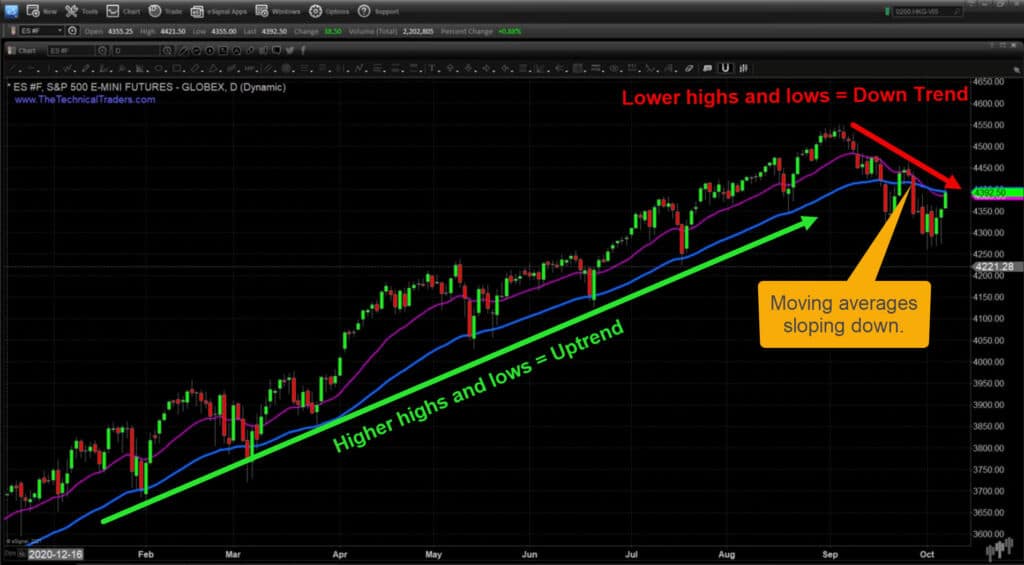
THE SP500 DAILY CHART
There are two moving averages here, the 50-day and the 20-day moving average. When the price is above these moving averages in general, and they’re sloping upwards, this means the market is most likely going to continue to trend higher.
When the price is sloping down, the price is below the moving average, and the 20-day moving average is below the 50-day, just what the market is doing this week; this tells us that there’s actually a mixed market signal. The market is struggling and in a new. As the saying goes, “the trend is your friend,” so it’s always best to trade with the market trend for the chart time frame you are following.
Sign up for my free trading newsletter so you don’t miss the next opportunity to learn more!
We’ve seen the SP500 break below the moving averages; it’s now rallied up and hit its head under them as resistance. When you look at the chart below, it gives you a good idea of the current trend. There is a series of lower highs and lower lows, which means we are in a short-term downtrend, but is this market about to start a new rally? Or is it going to roll over and continue to move down? That’s the big question.
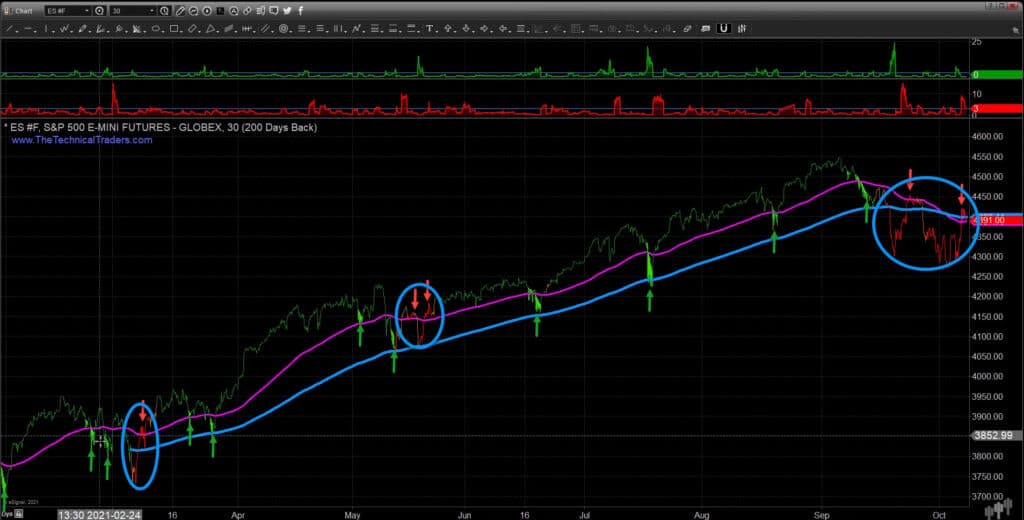
30 MINUTE CHART
The 30-minute intra-day chart zooms back to February. The lime green areas are cycle lows in the market, and the shaded red areas show an overbought cycle high.
Typically the market’s going to want to sell off and move lower after a cycle high. But, because the stock market is still in a major long-term bull market, we need to analyze price over the next few trading sessions. Is the SP500 is going to build a base and start to move higher, or is it going to break down and potentially collapse for a much deeper correction?
During mixed/uncertain times like this, moving to cash is the low/safe position to be in. Any moves from here will be big and fast, so if you are on the wrong side of the market, it can do a lot of damage to your trading account value. The odds/risk-reward is not favorable for short-term traders.
In general, because the SP500 is still in a bull market when the market has a pullback within, it will tend to resolve to the upside quickly, but there are no guarantees.
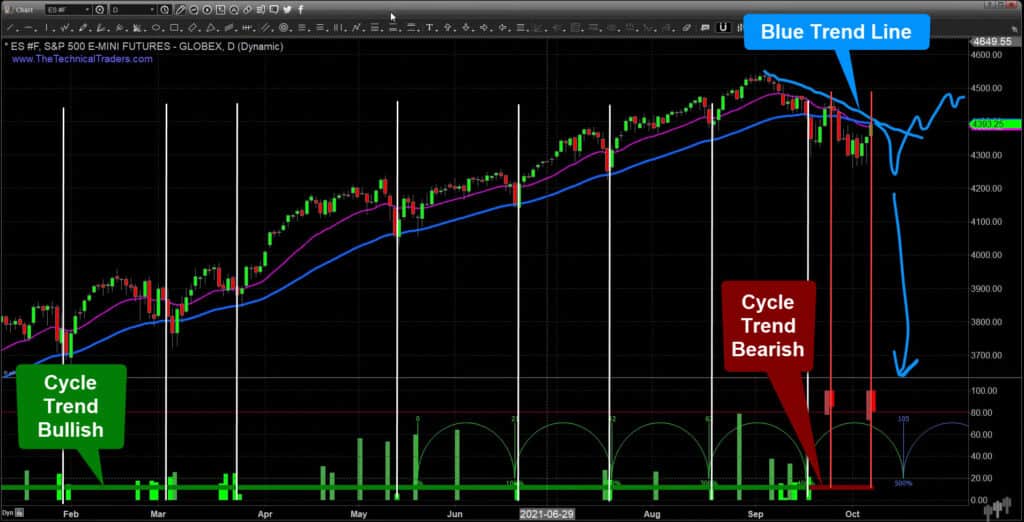
APPLYING CYCLE ANALYSIS
On the bottom of the chart, wherever there’s a cluster of green bars, it means there are various short-term cycle lows in price.
When this cycle analysis is red, that means the market has lost its upward momentum and is now trending to the downside. When cycle highs align with a resistance level on the chart, the market rolls over and pulls back just like we say in September and possibly what could happen during October.
Currently, the SP500 is rallying up based on the lower cycle, and you can see the red overbought cycle high forming right now. This means the market is most likely to struggle, and it could chop around for another week or two yet before starting a new rally.
The blue falling trend line can be seen on the chart, and if the price starts to break through that, then it will be the first sign of a new uptrend potentially starting.
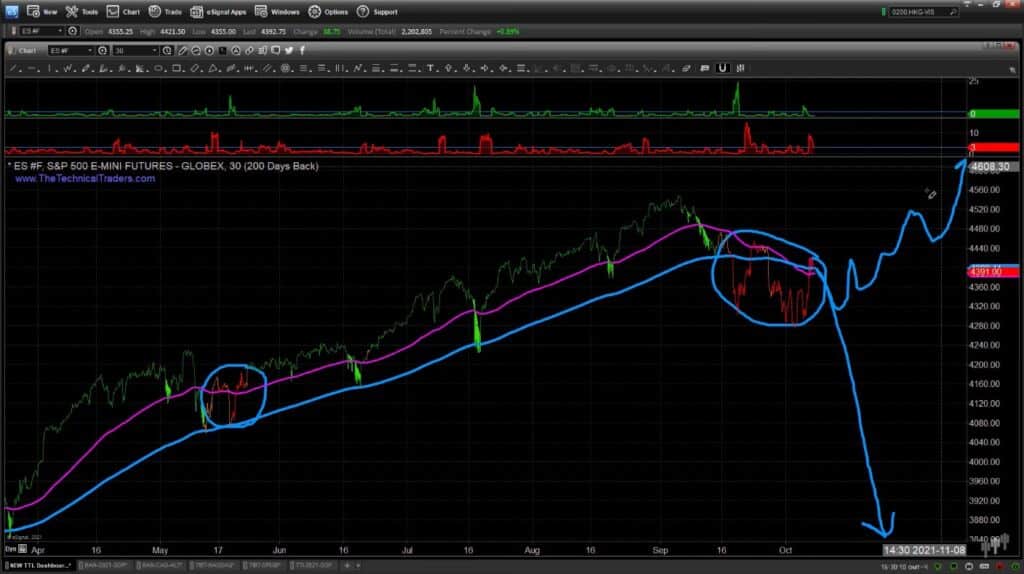
MANAGING POSITIONS
When the market completely crashes due to unforeseen circumstances like COVID-19 and breaks down, the price can fall quickly, and that’s why you need to manage positions and risks really well.
When you’re in a bull market, you generally don’t want to be shorting the market. Instead, you are better to sit in cash on the sidelines because the price can chop and trade sideways for potentially several days or a few weeks before moving in the next direction.
CONCLUDING THOUGHTS:
The SP500 will probably be volatile for another week as the market tries to stabilize and start a new trend. We will take advantage of the next move higher in the future. That could be at a slightly higher price from here or at a much lower price. Let the market dictate the new trend direction, and when we should get involved, don’t just trade because you think it may move in a direction before it has proven itself.
At TheTechnicalTraders.com I provide daily pre-market videos in much more detail. These videos let you know what to expect each day for day traders, swing traders, and investors as the market/charts unfold once bar at a time. Get my Total ETF Portfolio trading signals and learn technical analysis at the same time.
Chris Vermeulen