US Fed – The Battle Against Excess Global Captial Continues
US Fed Is Battling Excess Global Capital – Which Is Creating Inflation
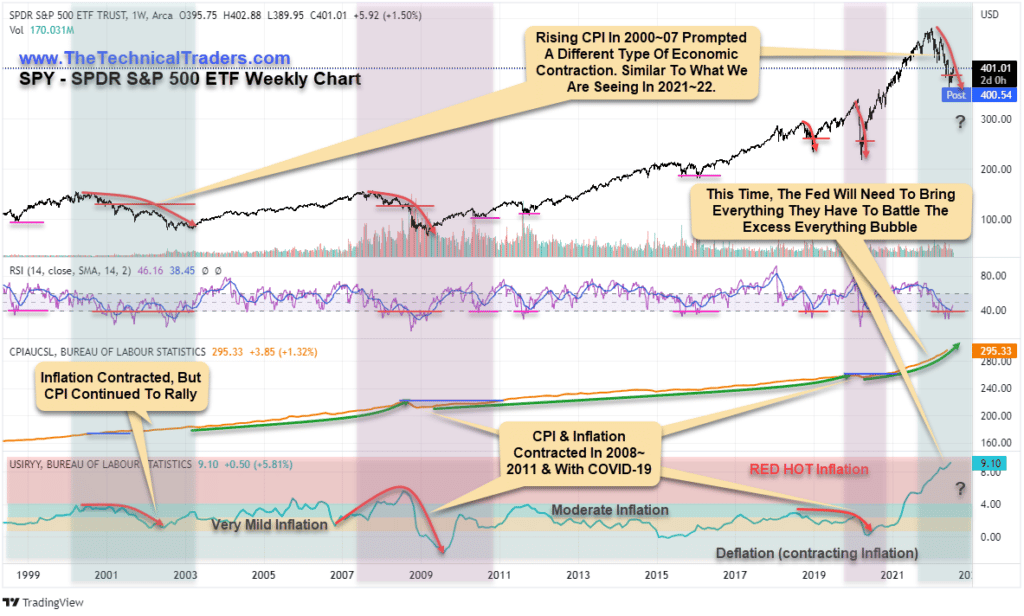
The US Fed continues to bring the big guns, raising rates another 75 bp (0.75%) on July 27, 2022. Even though they stated the economy is softening, current Inflation and CPI data suggest otherwise. The US Fed may be forced into another 75~100 bp rate increase next month if the US economy continues to show strong CPI and Inflation trends. There is only one other time in recent history like the current market environment – 1998~2004.
The DOT COM Bubble was unique in the sense that excess capital flowed into technology/internet companies’ hand-over-fist. It seemed all you had to do was register a URL, come up with some crazy business plan, and go talk to investors/VC. It was not a crisis like the 2008-09 Global Financial Crisis event. The DOT COM Bubble was a process of unwinding/consolidating excess capital away from a euphoric speculative phase in the markets.
I believe the current Pre & Post COVID market rallies are, again, very similar to the DOT COM rally phase – although this time, the focus is on foreign/global economies.
Fed May Have To Disrupt Global Currencies/Economies In Order To Tame US Inflation
There are some similarities to the 1998~2004 DOT COM bubble scenario in the current US markets. First is the rise in CPI and the huge increase in Inflation. CPI continued to rise throughout 1998~2008 – all through the DOC COM bubble disruption and up to the peak in 2007. The same type of thing is happening in CPI right now.
The reason why I believe the US Fed will continue to aggressively raise rates is because US Inflation is RED HOT, and the past few rate increases have done little to disrupt US economic trends. Yes, housing, retail sales, and manufacturing are starting to see a shift in demand/activity. But the Fed is trapped in a very difficult situation where they must attempt to unwind the capital excesses throughout the world by adjusting rates and capacity here in the US.
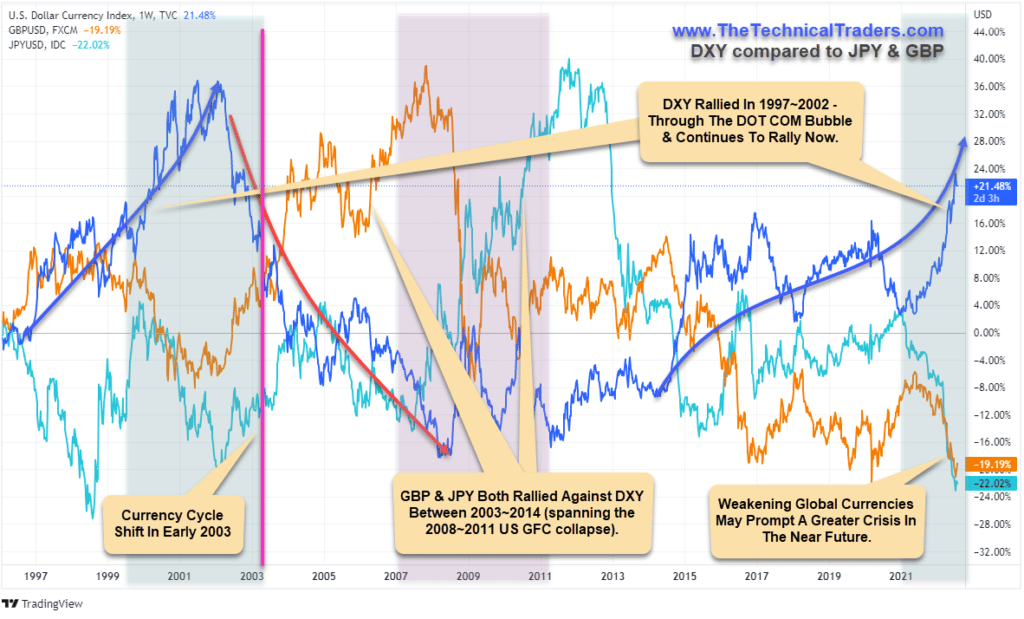
That means the global markets will react to what the US Fed is doing and attempt to chase opportunities in a stronger US Dollar until the US Fed is able to break this cycle (see the change of direction in currencies near 2003 below).
The Big Bang Event For Global Currencies Should Be Less Than 12 Months Away
I’m not going to try to predict when global currencies/economies will relent to the extreme pressures inching forward by the US Fed, Inflation, and other trends. But I will state that the GBP & JPY are already at a combined lowest ratio level compared to the US Dollar over the past 25+ years. I can only imagine the intense economic/valuation pressures that are stressing many foreign global economies/currencies as the US Dollar continues to strengthen. Debts, liabilities, ongoing expenditures, and essential services all need to continue for the people affected.
It may be just a matter of time before bigger cracks start to appear. We may see more uprisings and riots as we saw recently in Sri Lanka. We may see additional regional economic collapse events as at-risk nations strain to maintain their debts/liabilities. We’ll possibly see various aggressions ramp up as currency valuations get pushed toward the extremes.
Look at the US Dollar Rally in 1998~99 on the chart (above). Even though we had the DOT COM bubble burst in 1999~2000 and the 9/11 terrorist attacks in 2001, the US Dollar continue to strengthen until it broke down in late 2002 – nearly two years after the peak in the US stock markets.
If the US Dollar were to rally above 110 and potentially peak above 115, that would represent an additional +7% rally in the US Dollar – and possibly represent another -10%~-15% collapse in the JPY and GBP.
Let the currency wars begin. The Fed must continue to try to break US Inflation. To do that, it may have to break multiple foreign currency capital functions and push global capital functions from one extreme (speculation) to another (contraction).
LEARN FROM OUR TEAM OF SEASONED TRADERS
In today’s market environment, it’s imperative to assess our trading plans, portfolio holdings, and cash reserves. As professional technical traders, we always follow the price. At first glance, this seems very straightforward and simple. But emotions can interfere with a trader’s success when they buck the trend (price). Remember, our ego aside, protecting our hard-earned capital is essential to our survival and success.
Successfully managing our drawdowns ensures our trading success. The larger the loss, the more difficult it will be to make up. Consider the following:
- A loss of 10% requires an 11% gain to recover.
- A 50% loss requires a 100% gain to recover.
- A 60% loss requires an even more daunting 150% gain to simply break even.
Recovery time also varies significantly depending upon the magnitude of the drawdown:
- A 10% drawdown can typically be recovered in weeks to a few months.
- A 50% drawdown may take many years to recover.
Depending on a trader’s age, they may not have the time to wait nor the patience for a market recovery. Successful traders know it’s critical to keep drawdowns with reason, as most have learned this principle the hard way.
Sign up for my free trading newsletter so you don’t miss the next opportunity!
We invite you to join our group of active traders who invest conservatively together. They learn and profit from our three ETF Technical Trading Strategies. We can help you protect and grow your wealth in any type of market condition. Click on the following link to learn how: www.TheTechnicalTraders.com.
Chris Vermeulen
Founder & Chief Market Strategist