Bitcoin Rallies Above $20k – Targeting $23k Or Higher
In an incredible display of support, Bitcoin rallied above $20k early in the morning on December 16. This upside breakout move coincided with a very strong Fibonacci Price Amplitude resistance arc originating from the low price level near March 20th. The implications of this upside breakout suggest Bitcoin may continue to rally higher targeting levels just above the $23k level ($23,150).
Cryptos are experiencing a price rally that is similar to what happened in 2016 and 2017. The enthusiasm for these decentralized alternate assets continues to climb as traditional hedge assets, like Gold, Silver, and others, have stalled recently. What we find interesting is the correlation between Bitcoin price advances and Precious Metal price cycles.
Price Energy Waves Align Near December 28th, 2020
Our latest research article suggests the long-term US stock market cycle has transitioned into a Depreciation phase – where US stock market price levels are likely to trade in extremely volatile, possibly sideways/downside, trends over the next 5+ years. If our research is correct, global investors will search for assets that buck this trend in an attempt to seek out greater Alpha.
Cryptos and other market sectors, including precious metals, emerging markets and others, will likely experience a range of boom and bust cycles over the next 5+ years – very similar to what happened immediately after the 2010 global market bottom. If you remember, emerging markets and other global market sectors each rallied for a period of time as global investors sought to create Alpha from undervalued market sectors. When the momentum builds and capital chases other capital – we end up seeing trends that can be explosive for periods of time.
The following Daily Bitcoin chart highlights the incredible rally that initiated in early October (just before the US Elections). The alignment of this rally attempt initiating just after a Fibonacci Price Amplitude Arc ended, near the middle of October, is quite interesting. It suggests that the new upside price momentum was prompted by an energy wave that originated from the June 2019 peak in Bitcoin and may prompt a rally to levels above $23,000 soon.
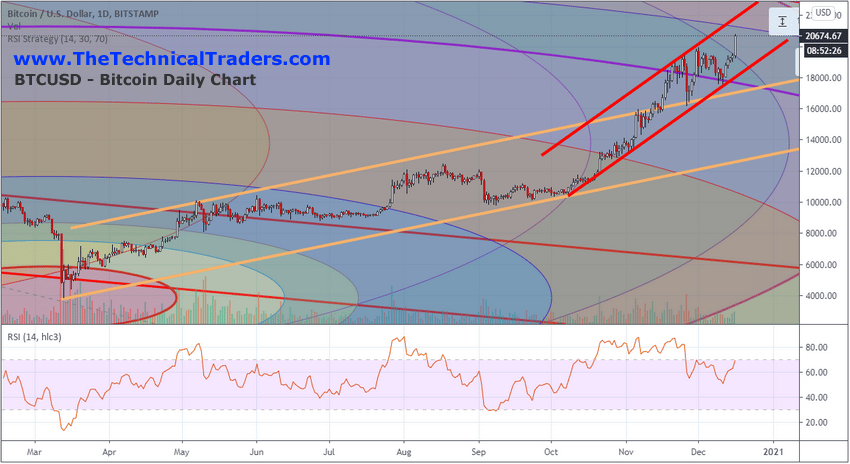
Pay very close attention to the new upside price channel (highlighted in RED) which has breached the previous price channel (highlighted in GOLD). As long as price stays within this new price channel, we can expect the rally to continue.
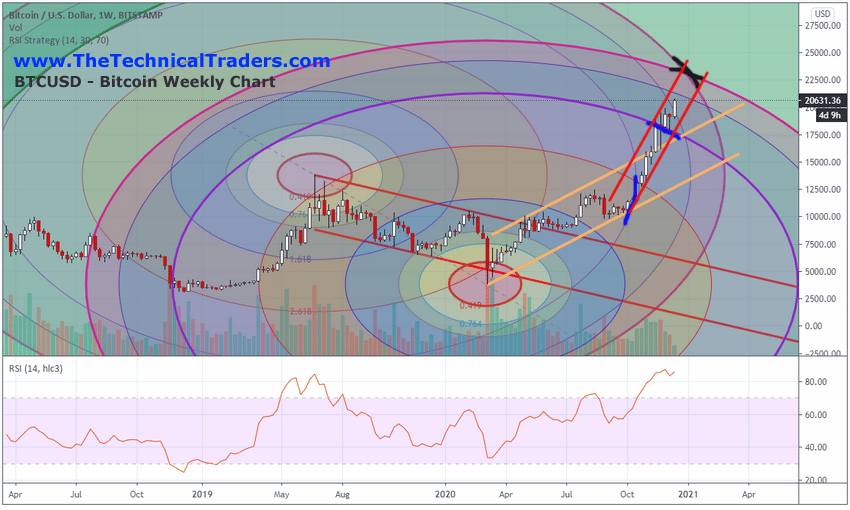
Weekly Bitcoin Target Suggests $23,150 Before The End Of 2021
The Weekly Bitcoin chart below highlights the same price action and shows our Fibonacci Price Amplitude Arcs across a longer-term span of time. You can see the BLACK marks we’ve drawn on the chart that highlight the target areas based on price energy waves (the Fibonacci Price Amplitude Arcs). These act as measures of price energy frequency and help us understand where and how price may react at certain price levels in the future.
Be sure to sign up for our free market trend analysis and signals now so you don’t miss our next special report!
If you take a very close look at where this current upside price trend initiated, near the middle of October 2020, you’ll see that prices had just passed through a 3.618 Price Amplitude Arc (highlighted in MAGENTA). Currently, the breakout rally also just passed through a 3.618 Price Amplitude Arc (highlighted in MAGENTA). The fact that both breakout rally attempts cleared the 3.618 Price Amplitude Arc may be foretelling in the sense that the 4.618 Price Amplitude Energy Arc cross (where the BLACK X is drawn) on both Fibonacci Price Amplitude Arcs near $23.150. Could this area be the ultimate peak target for Bitcoin? Where a new Energy Wave will setup?If so, this new price energy wave peak suggests a downside price target near $6000 in October 2021.
Bitcoin & Gold Alignment May Begin To Diverge Early In 2021
Comparing the price of Gold to the price of Bitcoin over the past three years suggests a moderately strong correlation between the two. In our Weekly custom chart below, you can see the upside price moves in Gold align very closely to the upside price moves in Bitcoin – excluding the euphoric rally in 2017 and in 2020. Something we found interesting is that while Bitcoin prices were declining in 2018, Gold price levels were setting up a very strong momentum base above $1200. Could a similar type of momentum base be setting up in Gold right now?
You should watch those Red Price Trend channels to determine when Bitcoin prices break the trend. Once that happens, price enters a new phase of trending and our Fibonacci Price Amplitude Arcs suggest December 28 is a key target date for the $23,150 peak.
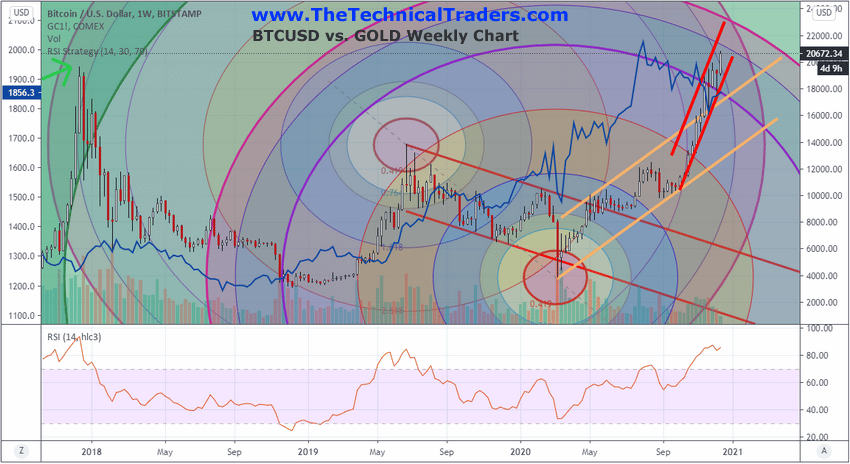
What is certain at the moment is that Bitcoin has reached new highs and appears to be rallying towards the $23k target level while Gold and Silver continue to attempt to establish a momentum base. We believe a peak will setup in Bitcoin, possibly before the end of 2020, which may change the dynamics of the relationship between Gold and Bitcoin. Any new price peak, which is similar to previous Bitcoin peaks, may prompt a very volatile and quick price reversal.
It won’t be long before we know how all of this plays out for Bitcoin traders/enthusiasts. We are certainly impressed by this rally and believe Cryptos have absorbed some of the traditional precious metals hedging activity recently. This is likely a process where global investors were able to move hedge capital into Cryptos while they were in a bullish trend/breakout as an alternative to more traditional precious metals hedging activity. If and when Cryptos reach a peak, a reversal of this hedging trend may take place – prompting a very big move in precious metals while Cryptos attempt to consolidate near a new higher base level (likely near $6000).
Until this trend ends, watch for the $23.150 target level to be reached near December 28, 2020. We believe that critical level will be a make-or-break level for any further advance in Bitcoin and may prompt a major change in market dynamics (relating to precious metals, global stock markets and other assets).
Our proprietary BAN (Best Asset Now) strategy allows us to know which assets are potentially the best performers in any type of market trend. If you want to learn more about how we can help you with our proprietary tools, strategy then go to www.TheTechnicalTraders.com to learn more. Sign up today to get my daily pre-market analysis of the markets that walks you through the technical indicators of the major asset classes. If you are looking to buy Bitcoin or other crypto-currencies then click here to learn how to do this.
Stay healthy!
Chris Vermeulen
Chief Market Strategist
www.TheTechnicalTraders.com
NOTICE AND DISCLAIMER: Our free research does not constitute a trade recommendation or solicitation for readers to take any action regarding this research. We are not registered financial advisors and provide our research for educational and informational purposes only. Read our FULL DISCLAIMER here.
TTTE