Could Gold Launch Into A Parabolic Upside Rally?
We believe Gold is setting up for an incredible upside breakout move after reaching our predicted target near $1450. For those of you that have been following our research and Gold calls, we’ve nailed this move and our October 2018 predictive modeling call has continued to mirror (almost exactly) the price movement in Gold over the past 10+ months. See the chart below.
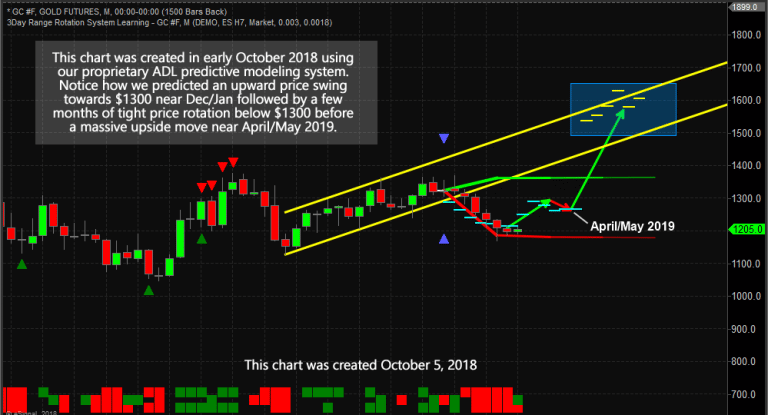
Our Adaptive Dynamic Learning (ADL) predictive modeling system suggested that Gold would rally from the $1200 level to above $1300, then stall. It suggested that in April or May of 2019, Gold would settle back below $1300 and set up a “momentum base” before attempting an upside breakout move after forming the base. Our research team identified April 21~24 as the likely “price low” for the “momentum base” using our advanced price cycle and other research tools.
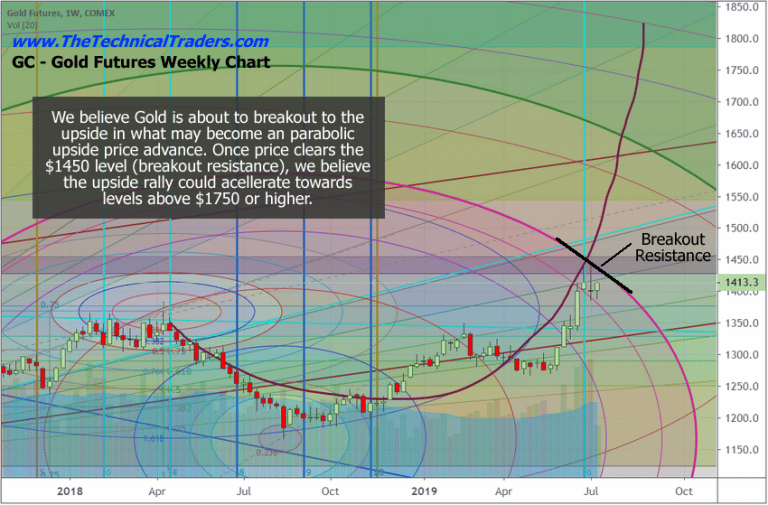
You can see from the chart, above, that our upside price targets from our original research are above $1550~1600. What if we told you we now believe the upside price targets could actually be above $1700 and more like $1750 to $1800 on a parabolic upside price rally initiating after price breaks critical resistance levels?
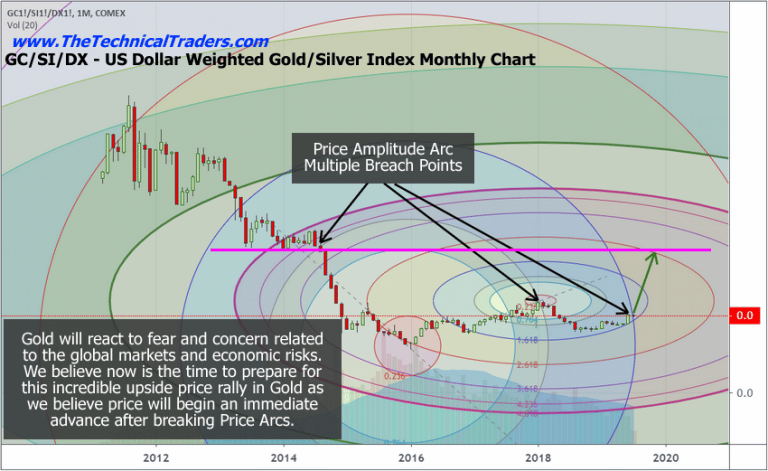
Take a look at this simple Gold/Silver/USDollar index chart. The purpose of this chart is to relate the price of Gold to the price of Silver in US Dollar price levels. It highlights that Silver is still very undervalued in comparison to Gold and that any attempt to restore a price balance between Silver and Gold would likely result in either two outcomes : A. the price of Gold falls, or B. the price of Silver rallies faster than Gold rallies whereas this ratio will attempt to balance out (as we see back in 2013/2014).
Our Price Amplitude Arcs are a means of measuring price cycles, price waves and allow us to seek out critical price inflection points. As you can see, where multiple arcs align and are breached by price, we typically see some type of increased price volatility and trending. Currently, two separate arcs are setting up to be breached and we believe this is important because of how it aligns with our October 2018 research post.
What would cause Gold to rally above $1600 at this time? Why would this become a period where renewed interest in precious metals could drive such a big move? We believe a number of global economic factors will become more evident over the next 30 to 60+ days and that these critical Price Amplitude Arcs are suggesting price is set up to rally from these levels. We believe the move higher will include both Gold and Silver and that Silver may rally stronger than Gold which would cause this Gold/Silver ratio chart price level to move higher – towards our objective line (MAGENTA).
We believe a key date for all traders/investors to be aware of is August 19, 2019 (+/- 5 days). We believe this will be the date range that the market will break out of existing ranges and when fear and greed will likely solidify in the precious metals markets. We have about 35 days to go before this date and we believe Gold will continue to trade below the “Breakout Resistance” until renewed fear and greed become more evident in the global markets.
Our Current Market Top Analysis and Charts – Click Here
This means the US Dollar will likely continue to rally, or at least stay above $96, for the next 25+ days and that upside US Dollar price activity will partially mute the upside price potential in precious metals. Overall, the upside price momentum in metals will push metals prices higher while the US Dollar continues to strengthen moderately. Once the US Dollar breaks lower, metals will skyrocket higher (breaking past the Breakout Resistance level) and begin the upside parabolic move.
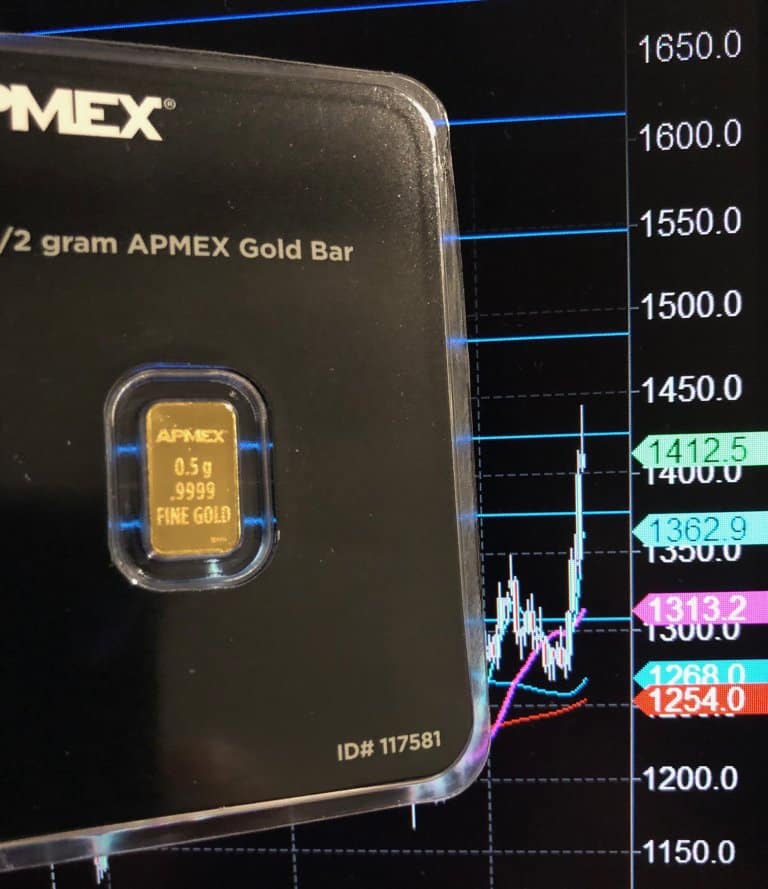
Any opportunity you find where Gold is trading below $1400 is an excellent opportunity to prepare for this move. Silver continues to trade below $15.50 and continues to be an incredible opportunity for traders who understand the ratio levels of precious metals. Don’t miss this move. It is just a matter of time (30+ days) now.
Be prepared for these incredible price swings before they happen and learn how you can identify and trade these fantastic trading opportunities in 2019, 2020, and beyond with our Wealth Building & Global Financial Reset Newsletter. You won’t want to miss this big move, folks. As you can see from our research, everything has been setting up for this move for many months – most traders/investors have simply not been looking for it.
Join me with a 1 or 2-year subscription to lock in the lowest rate possible and ride my coattails as I navigate these financial market and build wealth while others lose nearly everything they own during the next financial crisis. Join Now and Get a 1oz Silver Round or Gold Bar Shipped To You Free.
I can tell you that huge moves are about to start unfolding not only in currencies, metals, or stocks but globally and some of these supercycles are going to last years. A gentleman by the name of Brad Matheny goes into great detail with his simple to understand charts and guide about this. His financial market research is one of a kind and a real eye-opener. 2020 Cycles – The Greatest Opportunity Of Your Lifetime
As a technical analysis and trader since 1997, I have been through a few bull/bear market cycles. I believe I have a good pulse on the market and timing key turning points for both short-term swing trading and long-term investment capital. The opportunities are massive/life-changing if handled properly.
BILLION GIVEAWAY – REAL GOLD OR SILVER WITH MEMBERSHIPS
So kill two birds with one stone and subscribe for two years to get your
FREE GOLD BAR and enough trades to profit through the next metals
bull market and financial crisis!
SUBSCRIBE -> FREE GOLD BAR -> GET WINNING TRADES
Chris Vermeulen – www.TheTechnicalTraders.com