Custom Index Charts Show Clear Bullish Trending
My research team and I have created Custom Index charts that highlight the continued upside/bullish trend that is taking place in the US stock markets. We continued to stay moderately cautious in late October and early November because of the extensive price rotation at that time and because of the US election event. The dramatic rally in the US markets that started before the US elections prompted our research team to pause and evaluate how must risk was being ignored by the upside price rally. Initially, we discounted the rally as a speculative move in the market – likely to end badly and quickly.
Now, after our Custom Index charts have established moderate momentum signals and what appears to be a very solid global market influx of capital into various US market sectors, we believe this rally may still have some legs behind it.
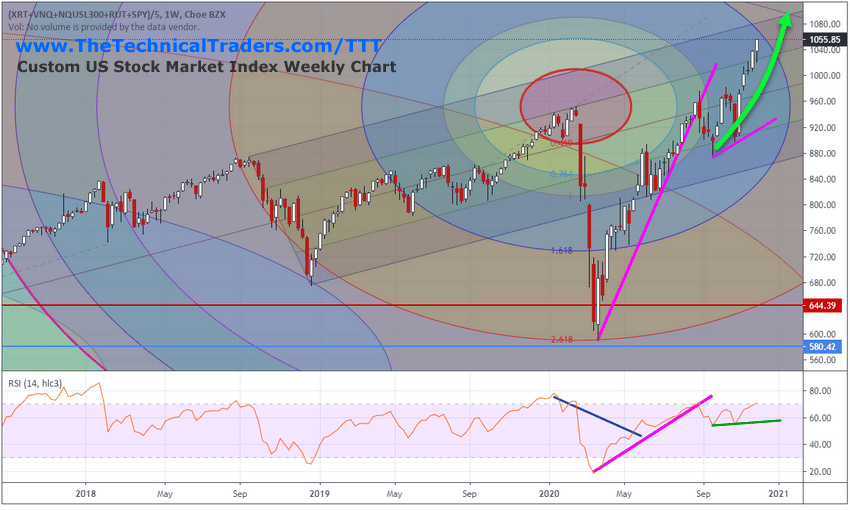
CUSTOM US STOCK MARKET INDEX CHART
My team has described this rally in the following terms:
“Forward expectations after the US elections as well as foreign market capital participation in various undervalued US sectors appears to be focused on the Small and Mid Cap sectors. Various other sectors, like Technology, Healthcare, Financials and Energy, appear to be strengthening as well”.
Investors may be pushing their capital into sectors that support a “green transition” into cleaner energy as well as sectors that may benefit from US government stimulus and policy (infrastructure) efforts over the next 24+ months. From the looks of the data/charts, it appears investors completely believe the opportunities within these sectors are still very valid and that these sectors may be dramatically undervalued. The next big rally in the US markets may be to watch these sectors recover to new all-time highs.”
Be sure to sign up for our free market trend analysis and signals now so you don’t miss our next special report!
The rally in the Custom US Stock Market Index chart below highlights the upside breakout just 2 weeks ago and the continued upside momentum that is tracking to push the US markets another 4 to 8% higher. Longer term, our researchers believe a 13% to 15% could be just starting after the US elections.
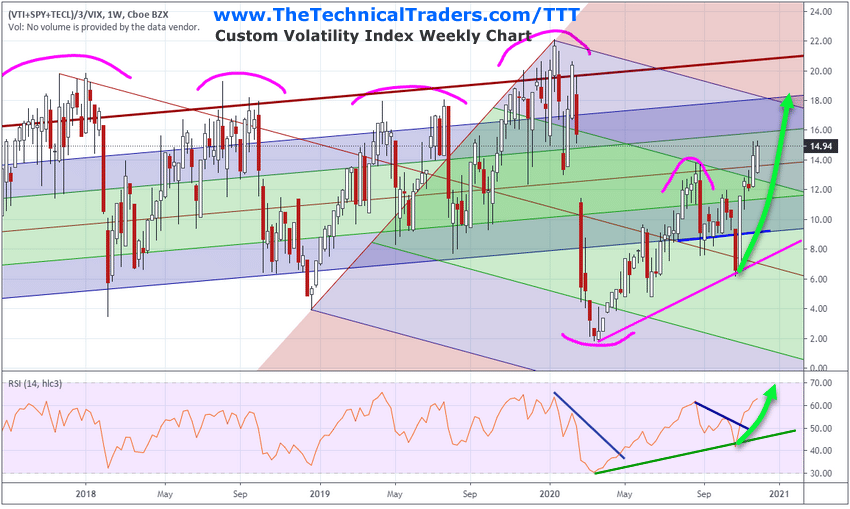
CUSTOM VOLATILITY INDEX CHART
We believe the current upside price trend represents global investors putting their capital to work in the US markets and targeting sectors that are currently undervalued. We witnessed a massive move to cash in the months before the US elections and it appears that capital is now deploying into the US markets in sectors that have continued to stay under some valuation pressure.
Overall, if the US stock markets continue to rally back toward normal volatility levels on our Custom Index chart, below, we may experience a 30% to 35% rally in the Volatility Index – which we believe would equate to a 9% to 15% rally in the US stock market over time.
We believe the technical confirmation of this upside rally trend has now confirmed and that traders should start engaging with this rally in a more aggressive form. We certainly believe risks are still elevated at this time – but we have to follow the capital in regards to where global investors are pushing their investments. The opportunities are there for the markets to continue to rally well into 2021 as new government stimulus and policy continue to drive strong sectoral growth.
As we move towards 2021, pay attention to how the markets react to the continued recovery efforts and global banking/policy issues. A variety of sectors could become a very profitable sector for traders. We can help you find and identify great trading opportunities so visit www.TheTechnicalTraders.com to learn about my exciting ”Best Asset Now” strategy and indicators. Sign up for my daily pre-market video reports that walk you through the charts of all the major asset classes every morning.
Chris Vermeulen
Chief Market Strategist
www.TheTechnicalTraders.com
NOTICE AND DISCLAIMER: Our free research does not constitute a trade recommendation or solicitation for readers to take any action regarding this research. We are not registered financial advisors and provide our research for educational and informational purposes only. Read our FULL DISCLAIMER here.