Stock Market Analysis & Warning In Layman’s Terms
As you likely know, the stock market, trading, and even long-term investing are not easy. That’s why in this post we want to make the complex simple for you. We will do this in a way that will give you that “Eureka!” moment regarding knowing what the stock market is doing now, and where it is headed over the next 12-36 months.
Last August we spotted trends in the underlying financial system that are very early warning signs that the bull market in stocks will be coming to an end, along with this growing economy. There is a ton of data taken into account for this information, but we have broken it down into simple bite-size points that simply make logical sense, from a technical analysts perspective.
First Warning
Back in April 2017, we posted an article showing the first set of data that most traders and investors do not see or follow, mortgage delinquency rates. Delinquency rates in Single Family Residential Mortgages and other Consumer Loans began to climb through the second half of 2016 and continue to rise today. We shared with readers a way to take advantage of this using the Real Estate Bear Fund (DRV). This fund is now up over 20% and climbing as it rises when real estate falls. The rise and timing of this delinquency rate increase coincide almost identically with the Fed when they raise rates. And the problem is not just mortgages defaulting, the same is happening with commercial loans, and credit card debt.
Just look at what has the fed being doing like a mad-man of late? Ya, jacking up rates like they are going out of style!
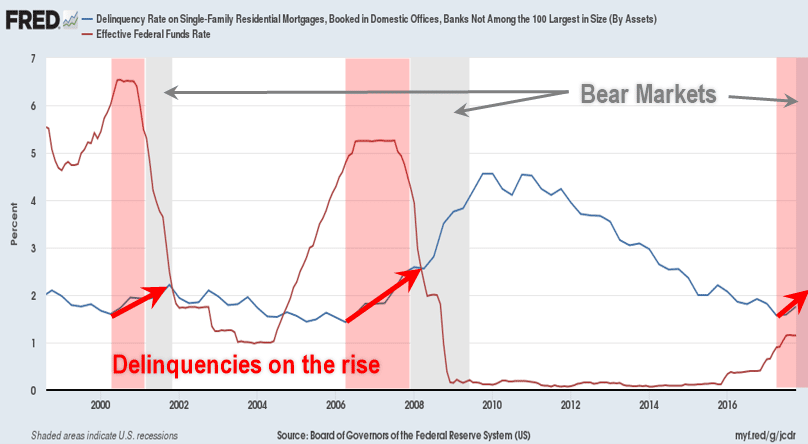
The graph below shows a red line which is the fed rate, and as that rises so do loan delinquency rates (blue line). You will also see the grey shaded areas on the graph, and these are bear markets (falling stock prices). It’s obvious that we are headed towards financial issues once again with debt and the stock market.
Mortgage Rates and Delinquency Rates on the Rise
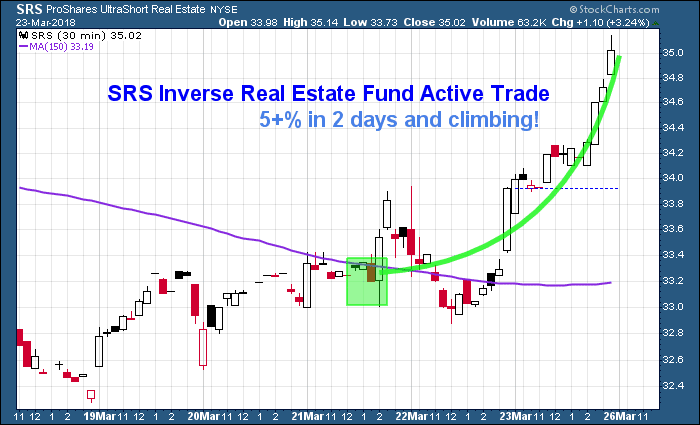
On March 18th 2018 we post an update showing how real estate foreclosures are starting to rise dramatically! Subscribers to our Wealth Building Trading Newsletter took advantage of this as we got long SRS inverse real estate fund which jumped over 5% in the first two days of owning it.
Second Warning – Asset and Business Cycles
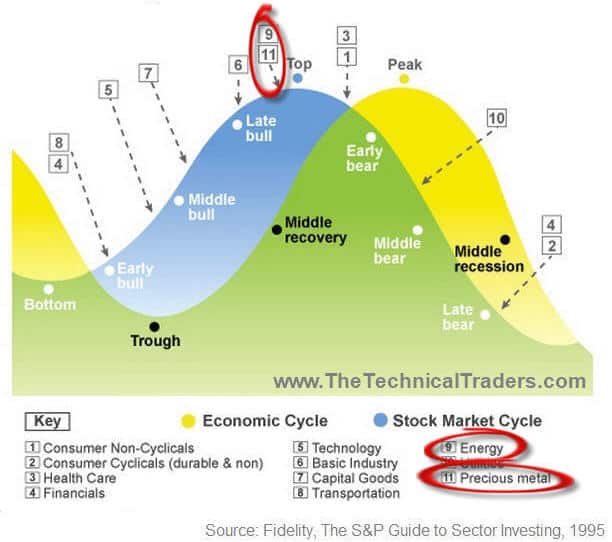
Because we are traders and investors our focus is on making money, so we are only looking at the blue wave/cycle on the diagram below. The blue cycle is the stock market, and the numbers posted along that cycle indicate which stocks/assets should be the most in favor, rising.
As you can see the numbers 9 and 11 at the top are both commodity based (precious metals and energy). And knowing that commodities typically perform well just before a bear market in stocks unfolds, we are on the cusp of a new trade that could last a few months and post significant gains.
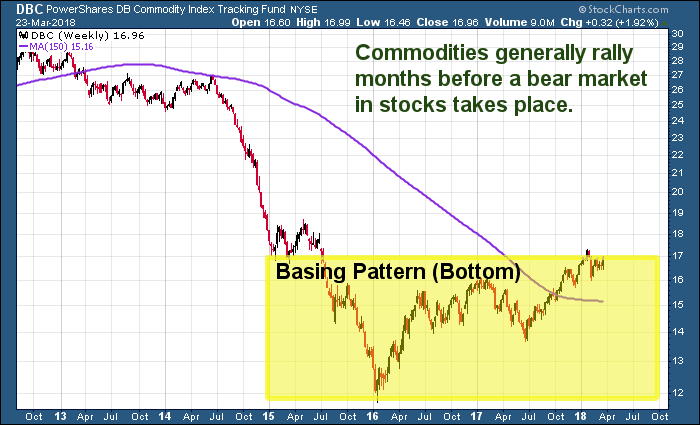
Commodity Price Index
Take a look at the commodity index chart below. Without getting to deep in to stage analysis I will just say commodities have formed a very strong “Stage 1” and are primed and ready for a multi-month rally.
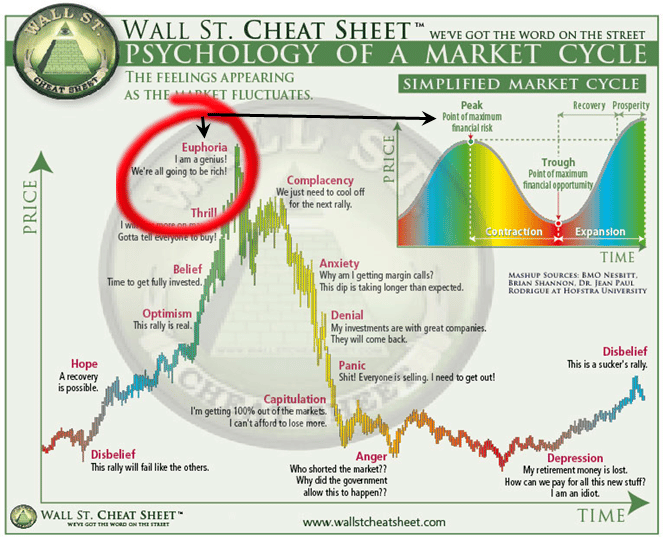
Third Warning – Psychology Of The Market
This market appears to be in a EUPHORIC “wonderland” moment driven by the fact that the global central banks have created a waterfall event of cheap money that is driving all of this asset valuation recovery. And, as capital is continually searching for the best environment for ROI, it is moving into the best areas of the global economy for survival purposes which we feel should soon be commodity-related assets, then eventually cash once the bear market takes hold.
Stock Market Conclusion:
In short, as long as the capital continues to flow into the securities (stocks) and commodities in search for the best return on investment, we will continue to see markets hold up. But, stay cautious because when the markets turn and money is no longer looking for the next top performing sector or commodity, but rather just wants to exit investments as a whole and convert to cash (cash is king), that is when the bear market starts, and it could be very quick and violent.
Additionally, as we’ve shown with these charts and graphs today, we are entering a frothy period in the markets, and we would urge all investors to be critically aware of the risks involved in being blind to these facets of the current stock market and housing bubbles.
With 53 years experience in researching and trading makes analyzing the complex and ever-changing financial markets a natural process. We have a simple and highly effective way to provide our customers with the most convenient, accurate, and timely market forecasts available today. Our stock and ETF trading alerts are readily available through our exclusive membership service via email and SMS text. Our newsletter, Technical Trading Mastery book, and 3 Hour Trading Video Course are designed for both traders and investors. Also, some of our strategies have been fully automated for the ultimate trading experience.
Chris Vermeulen
Technical Traders Ltd.
Have These Articles Automatically
Posted on Your Website with RSS