Energy Sector Setting Up For Another Big Trade
Our research team has been nailing some really great trades recently in Gold, Silver, Crude Oil, ETFs, and many other market segments. Some of these trades have resulted in fantastic gains of +10% to +20% for our members.
One trade in particular that we called back in July was the Energy trade in Crude Oil and ERY. Specifically, we suggested that Crude Oil would fall based on our ADL predictive modeling system and that ERY would set up a very nice trade with targets set relatively close to the basing/bottom pattern. But first, be sure to opt-in to our free market forecast signals newsletter
You can read our original research here:
July 10, 2019: PREDICTIVE MODELING SUGGEST OIL HEADED MUCH LOWER
July 26, 2019: ENERGY SETS UP TWO NEW TRADES – HERE THEY ARE
While the original setup resulted in a fantastic trade setup and completion – where both targets hit and the price extended more than $10 beyond our Target 2, we are now alerting you that ERY will likely set up another, even bigger, opportunity over the next 30+ days.
We believe our previous research, particularly related to Crude Oil, will result in ERY rotating lower over the next 20+ days, possibly towards the $50 level, before setting up another momentum base and beginning an upside move targeting the $70 to $75. If our research is correct, this move will come at a time when global markets are expecting must slower economic activity and/or a massive supply glut in Oil.
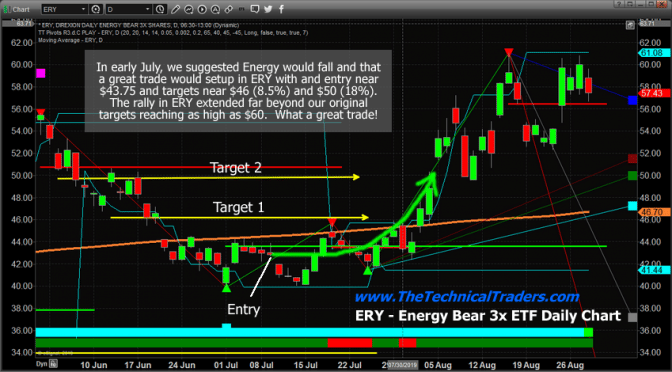
Daily ERY Chart (Inverse Energy Sector ETF)
This Daily ERY Chart shows the original trade setup that occurred after our July 26 post and includes the original target levels drawn as YELLOW ARROWS on the chart. It is easy to see the success of this trade and how ERY rotated higher as Crude Oil weakened.
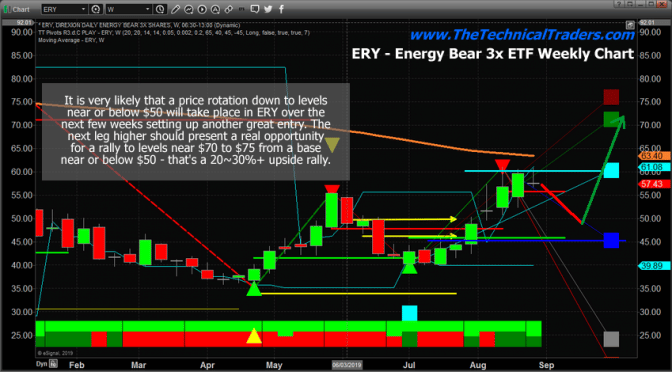
Weekly ERY Chart (Inverse Energy Sector ETF)
This Weekly ERY chart highlights what we believe will be the next trade setup which will start to complete the momentum base sometime near the end of September or into early October. We expect the rally in ERY to begin in mid-October and carry on into November, based on our ADL predictive modeling system (see the original article listed above).
We believe the downside rotation in ERY that we are expecting will coincide with a moderate upside move in Crude Oil over the next 30+ days before a bigger breakdown in Oil prices creates this incredible opportunity in ERY. Skilled technical traders just need to wait for the momentum base to complete. I just posted this gold and silver trading setup unfolding here.
Check out these exciting charts full of opportunities that we will be sharing.
CONCLUDING THOUGHTS:
If you follow our ADL predictive modeling system’s research, you’ll see that it expects Crude Oil to break down to levels below $40 before or near the end of 2019. That move could come quicker than we expect is global markets accelerate the economic slowdown we’ve seen recently. We’ll keep you informed of this, and other, great trades as they setup.
Ride my coattails as I navigate these financial market and build wealth while others lose nearly everything they own during the next financial crisis.
In short, you should be starting to get a feel of where commodities and asset class is headed for the next 8+ months. The next step is knowing when and what to buy and sell as these turning points take place, and this is the hard part. If you want someone to guide you through the next 12-24 months complete with detailed market analysis and trade alerts (entry, targets and exit price levels) join my ETF Trading Newsletter.
As a technical analysis and trader since 1997, I have been through a few bull/bear market cycles. I believe I have a good pulse on the market and timing key turning points for both short-term swing trading and long-term investment capital. The opportunities starting to present themselves will be life-changing if handled properly.
FREE GOLD OR SILVER WITH SUBSCRIPTION!

Chris Vermeulen – www.TheTechnicalTraders.com