Fear Drives Market Expectations
The continued upside price move in Gold is a very clear sign that fear is starting to enter the global markets again. We read an article last night that suggested many professional fund managers are preparing for a bigger downside price move as well as expecting the US Fed to potentially decreased interest rates over the next 12 to 24 months as the expected downside price move takes place. We understand this concern by many industry professionals and share some of their same concerns, yet we believe these individual are far too early in shifting their stance in the markets right now.
As you may be aware, our research does not show any major downside risks until later in July 2019 or August 2019. Even then, the price of the Dow Jones Index would have to fall over 18% before the December 2018 lows become threatened. The current upside price recovery, with the Dow Jones up over 400 pts from the lows on Monday, June 3, suggests the US market and the Capital Shift that has been taking place over the past 24+ months is still rather strong with investor buying dips. We told our followers this bounce was about to happen the day before it bottomed here.
It seems that everyone is trying to pick a top or call the big crash right now. Back in November 2018, it seemed like every professional trader we knew was advising their client “This is the BIG ONE” and suggesting the US markets could never recover from a deep sell-off like the one we experienced in late 2018. Yet, here we are, after reaching near all-time highs again, rotating a bit lower and the same voices seem to be stating “This is the BIG ONE” again.
Allow us to help clear up what is likely to happen based on our research and proprietary modeling tools.
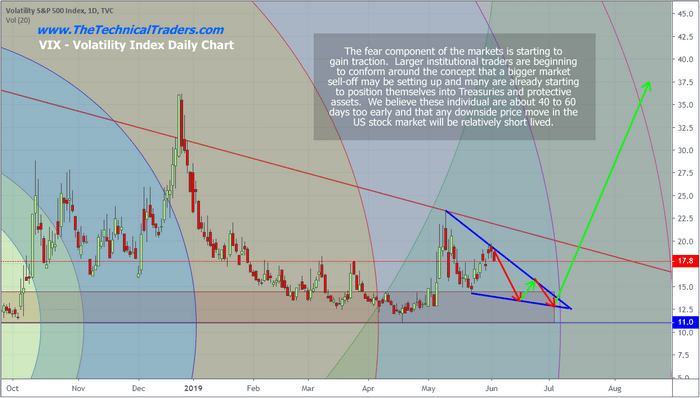
This first chart of the VIX (Volatility Index) shows what we believe to be the most likely outcome over the next 30+ days. After a spike in the VIX in early may which our followers profited over 25% in a few days, we believe a downward pricing channel will set up where the VIX will continue to drift lower – eventually settling back below 14 again for another setup. It is very likely that this volatility consolidation coincides with a US stock market price recovery over the same span of time. We’ll get into more detail in the following charts.
Eventually, sometime in mid-July or mid-August, we expect the VIX to spike well above 20 to 22 as a broader US stock market price collapse takes place.
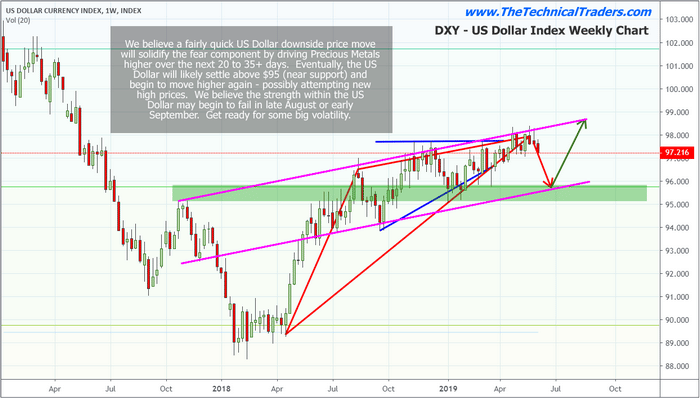
Throughout our expectations, we expect the US Dollar to enter a similar type of price pattern – setting up a Pennant formation after a moderately deep price correction nearing the $95 level. We believe the US Dollar will continue to move lower, driving precious metals higher, where the $95 support level is the key target. Once this level is reached, we believe the US Dollar will rotate higher and attempt a move above $97.50 again – possibly attempting new price highs. These new highs are likely to happen in early to mid July 2019.
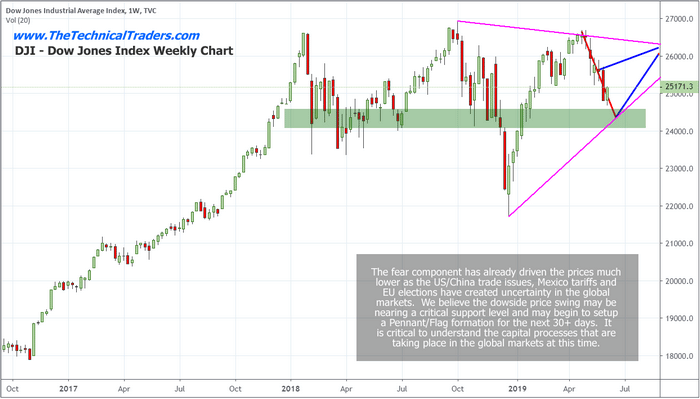
Our last chart highlights what we believe will happen in the Dow Jones Index (as a general market example of what will likely happen in the ES, NQ and YM). As you can see, we believe the downside price swing that has currently taken price nearly -7.25% lower should be very close to completion. We believe the $24,300 to $24,600 level will act as strong support for this move and prompt another upside price leg over the next 7 to 14 days. We believe this upside price leg will push the DJI price level back towards the $26,000 level by late July or early August 2019.
We are suggesting that the early move into a protectionist stance by professional traders may be about to experience some extreme pressures. Should the US/China trade issue or the Mexico trade issue lessen or be resolved over the next 60+ days, the US stock markets could rally towards new highs fairly quickly. If things stay the same as they are now, we expect price to move exactly as we have highlighted on these charts.
Near the end of July or sometime in August 2019, we expect a bigger top formation to setup where a moderate price collapse may take place. Everything must setup perfectly for this to happen and we still have 40 to 60+ days of trading before this setup gets closer. Lots of things can happen over this span of time, so pay attention to our continued research to stay ahead of these moves.
One thing you can do to prepare for any future price volatility or rotation is to accumulate Gold and Silver positions near recent lows. If you like precious metals see my forecasting signals here This increase in volatility means that precious metals should continue to push higher as fear becomes more rooted across the globe.
We’ve now shown you two different price setups using Fibonacci price theory and the only thing we have to do is wait for a technical price confirmation before finding our entry trade. We’ll see how this plays out over the next few days and weeks. Remember, we are not proposing these as “major price bottoms”. They are “upside pullback trades” (bounces) at this point. A bullish price pullback in a downtrend.
BECOME A TECHNICAL TRADER TODAY AND
TRADE WHAT MATTERS – PRICE ACTION!
CLICK HERE
Chris Vermeulen