Is Natural Gas Setup For Another Rally Attempt?
Recent downward price trends in Natural Gas have setup a nearly perfect 100% price contraction equal to the price contraction from the highs near late August to the lows in late September – totaling $0.95. The current highs near early November, $3.393, to the recent lows, $2.381, represent a $1.012 range – a 106.52% expansion of the August~September price contraction. We believe Natural Gas may be setting up another “100% Measured Move” price structure where a new upward price rally may push Natural Gas price levels above $4.15 in the near future.
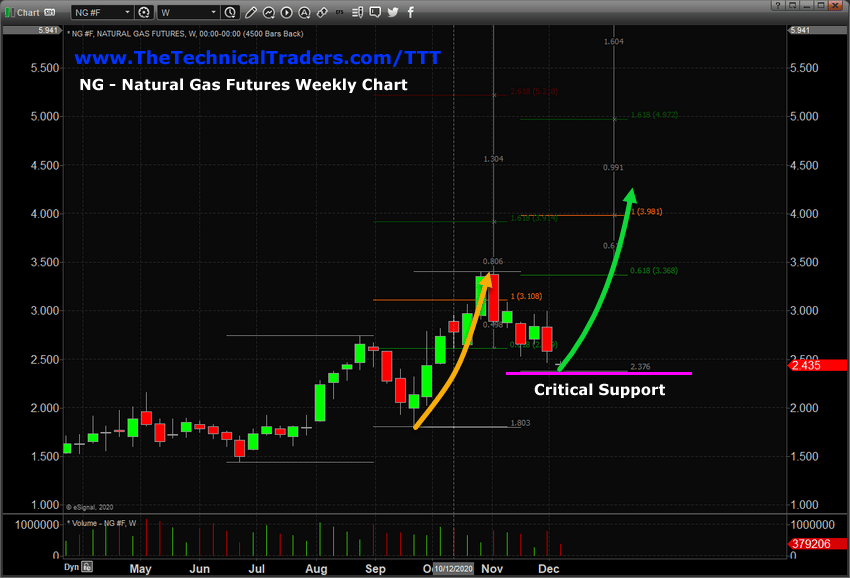
NATURAL GAS 100% MEASURED MOVE SETUP
The upside price move highlighted on this Weekly chart (the orange line) shows a 125% Fibonacci Price Expansion of the previous upward price trend from the lows near mid-June to the highs in late August. If another rally were to take place which was similar to this 125% range expansion from the current lows, the upside price target would be somewhere near $4.15 to $4.25.
The Technical Analysis structure behind our analysis of Natural Gas is that a nearly perfect 100% Measured Move price contraction is taking place which may prompt another 100% Measured Move price advance equal to the previous price advance – equaling a $1.90+ price advance targeting $4.15 to $4.25.
Historically, January and February are predominantly bearish for Natural Gas. Over the past 25 years, Natural Gas has only moved higher in January and February in 9 or 10 of those years. Therefore, any upward price move in Natural Gas after the end of 2020 would be somewhat of a price anomaly.
Having said this, the largest monthly advance in January for Natural Gas is $1.37 and for February is $2.49. If an anomaly were to happen late in 2020 or early in 2021, Natural Gas would find support above $2.35 and begin to advance higher, setting up the 100% Measured Move structure, then advance towards $4.00 or higher as price accelerates within this trend. If this technical pattern fails, then Natural Gas will fall below $2.35 – breaking the 100% Measured Move structure and establishing a new downward price trend.
Ultimately, the current price lows in Natural Gas suggest a “make or break” setup is taking place right now and we are watching this setup to determine if our research team has pinpointed a valid opportunity for a potential 80% rally in Natural Gas. If you want to learn how our team of traders and researchers can help you find and execute better trades, then visit www.TheTechnicalTraders.com/TTT to learn about our Best Asset Now (BAN) technology and how you can simplify your trading.
Happy Trading!
Chris Vermeulen
Chief Market Strategist
www.TheTechnicalTraders.com
NOTICE AND DISCLAIMER: Our free research does not constitute a trade recommendation or solicitation for readers to take any action regarding this research. We are not registered financial advisors and provide our research for educational and informational purposes only. Read our FULL DISCLAIMER here.