Is The Bull Trap Complete? Are We Flagging Out Into A Correction?
RESEARCH HIGHLIGHTS
- Speculative traders and “reality event” distractions have pushed the US markets into a perfect “Bull Trap”.
- Our Custom Charts highlighting the Smart Cash, US Stock Market, and Valuation indexes are clearly signaling warnings of a pending correction.
- A failure of price near current highs would complete the “Bull Trap” pattern and potentially send prices 11% to 15% lower in short order.
- Stay very cautious with your investments throughout the end of 2020 and beyond.
Some of you may be old enough to remember when Desert Storm started in January 1991. The news of this war took the US and the world by storm – almost literally. It was televised and it changed the way people lived their lives at that time. People were almost glued to the TV watching the videos and satellite feeds. It turned into the ultimate reality TV series – must see TV.
The US markets reacted to this foreign engagement. At first, the markets rallied for about 7+ weeks in early 1991, then they started to consolidate below resistance. For many people and businesses, this new reality event presented very real challenges for revenues and growth. Many businesses were forced to close because of the sudden shift in consumer activity and concerns. The reason I’m bringing this up right now is because I believe we are experiencing a new type of “reality event” (actually events) that has transitioned to become a driving force in the markets, namely COVID and the protests/riots in many cities across the US.
CHAOS & DISEASE – THE ULTIMATE DISTRACTIONS
With the US Presidential Election only about 60+ days away and winter fast approaching, the US has a number of fundamental issues to contend with going forward. What happens if the US elections are contested in the courts? What happens to policy and the support for the consumer/markets when the US government potentially enters this chaotic phase? What happens when winter hits and businesses that have been struggling through the warm summer months suddenly find themselves losing more revenues and customers? What happens if the streets remain in a state of unrest throughout the rest of this year and into next year?
Are valuations and stock price levels really supported by future expectations that equate to current price values? Have investors jumped on the recovery train and ignored the real risks that are setting up in the US and global markets? What would really happen if the US suddenly threw the world a massive curve-ball shortly after November 3, 2020?
Some of our most recent articles, including our recent Expanding Wedge research and seminal Super-Cycle article have suggested traders stay very cautious of these new all-time highs. All of this leads us to warn that a “bull trap” may be setting up. This is when prices move to new recent highs, then stalls out, setting up a trap for investors that have piled into the new high trends expecting it to continue. In Japanese Candlestick terms, this is commonly referred to as a “Scouting Party” or a “Three River Evening Top/Star” pattern. The point being that a reversal at or near all-time highs can be relatively dangerous if you have not prepared and protected your positions.
ARE THE MARKETS FLAGGING OUT?
Recently, we also wrote about a broader market Head-and-Shoulders pattern that has setup in the markets using our Custom Index charts and across other symbols. We believe this broader Head-and-Shoulders pattern is warning that a bigger market pattern is setting up where weakness headed into the US Presidential Election and end of 2020 may prompt a fairly large price correction. The “Bull Trap” pattern we are suggesting may be forming may become the peak/right-shoulder of the broader price pattern.
For the “Bull Trap” to complete, we would need to see a change in price trend where the Head-n-Shoulders pattern was likely still in place. We believe we are very close to this event right now. Just last week we authored an article about Dow Theory and price trends that suggests the markets are in an “Excess Phase” and starting to enter an end of trend phase. A change in price trend, where the DJ Utilities moves lower with bigger volume would help to confirm this setup.
Be sure to sign up for our free market trend analysis and signals now so you don’t miss our next special report!
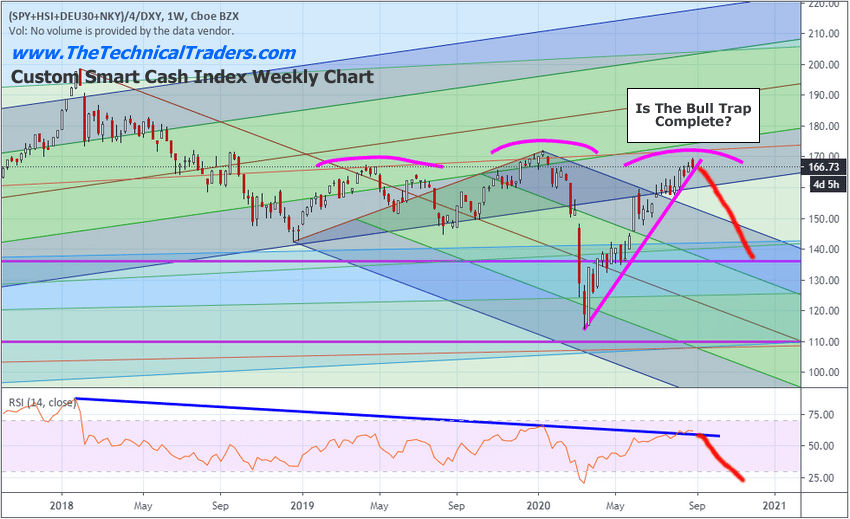
The Custom Smart Cash Index Weekly chart below clearly highlights the Head-and-Shoulders Pattern and the potential “Bull Trap” setup. A breakdown in the upward sloping price trend would likely trigger a broader market pullback targeting the April/May 2020 lows.
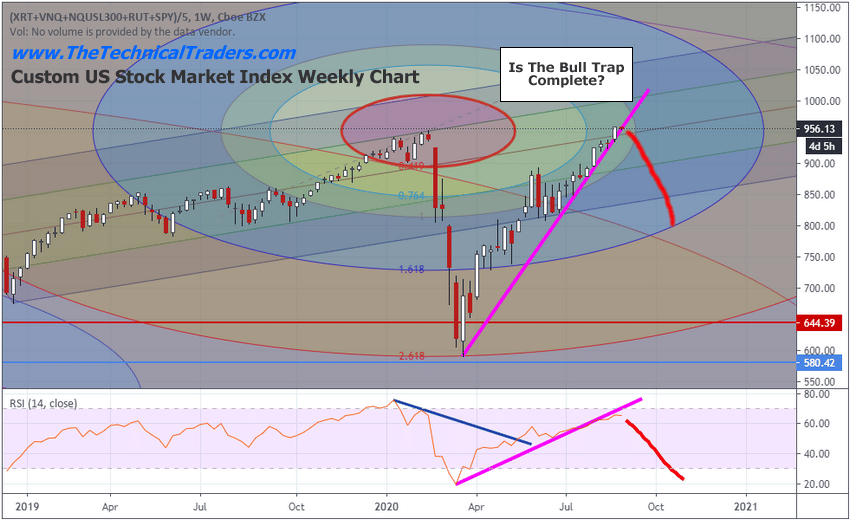
The following chart, our Custom US Stock Market Index Chart, also highlights the “Bull Trap” pattern. After the highs set in February 2020, the recent highs have just barely broken above the previous (Feb 2020) highs and stalled. Price is currently trading very near to the upward sloping price channel and we have very clear Divergence between the two major peaks on the RSI indicator. A failure of price near these current highs would complete the “Bull Trap” pattern and potentially send prices -11% to -15% lower.
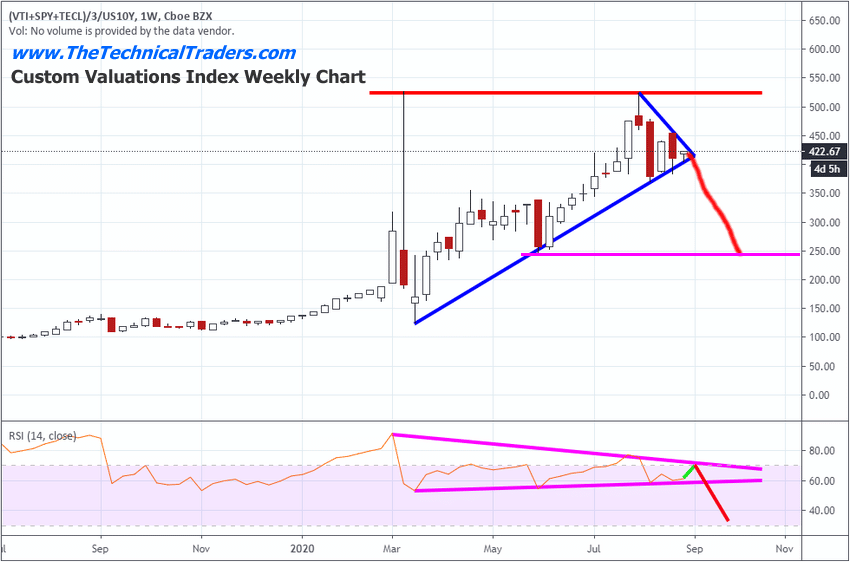
Lastly, we wanted to highlight our Custom Valuations Index Weekly chart, below, which shows the Double-Top setup in valuations from the initial collapse/bottom in price near March 20, 2020 and the recent peak in price near August 20, 2020. We believe this setup completes a Flagging/Pennant formation in price that suggests a deeper downside price correction is in the works. The “Bull Trap” pattern also leads us to believe a downside price move is very likely. When we add the “reality events” into the mix and the potentially destructive economic process related to everything associated with these events, along with the Presidential Elections, winter, and a potential second wave, we see a very real reason to warn investors to stay very cautious and watch for a potentially vicious downside price move in the near future.
Precious Metals, Bonds and CASH will be king throughout this correction, even if they suffer some initial volatility in a big market correction. Make sure to position your portfolio to take advantage of any continued “melt-up”, but be very aware of the future risks associated with the chaos that appears to be driving the underlying factors. Yes, the technology stocks may continue to rally if the speculative traders continue to ride that trend, but when it breaks, which it appears to be very close to doing, the downside move could be swift and dangerous if you are not prepared.
Follow our research and stay ahead of these moves. We’ve helped our members find successful trades throughout these big trends and stay protected in the process. We focus our attention on developing a balance for our members that protects assets while attempting to profits from clear trade setups. We don’t like taking excessive risks in the markets – we would rather trade when the setups are valid and confirmed by our other proprietary trend/price systems.
Pay attention. There will be no Mulligans in this round of play. You’ll either be prepared for what is likely to happen or you’ll take far greater risks than you should throughout the next 5+ years. We’re here to help. Read our research and learn how we can help you protect and grow your wealth. Get our Active ETF Swing Trade Signals if you are a swing trader or want to improve your trading strategies with technical analysis with our daily pre-market walk through of the charts of all the major indexes and sectors. If you have any type of retirement account and are looking for signals to warn of BIG market moves then be sure to join the Technical Investor to get my Passive Long-Term ETF Investing Signals.
Chris Vermeulen
Chief Market Strategist
Founder of Technical Traders Ltd.
NOTICE AND DISCLAIMER: Our free research does not constitute a trade recommendation or solicitation for our readers to take any action regarding this research. It is provided for educational purposes only. Read our FULL DISCLAIMER here and visit www.thetechnicaltraders.com to learn how to take advantage of our members-only research and trading signals.