Major Indexes Continue To Be Outperformed By Energy & Metals
Recent rallies in the major indexes have had a hard time hanging onto their gains lately. ETFs like XOP (S&P Oil & Gas Exploration & Production), XME (S&P Metals & Mining), and XLU (Utilities) have been experiencing capital inflows. At the same time, other ETFs such as DIA (30-Industrials), SPY (500-Large Caps), IWM (2000-Small Caps), IYT (Transports), and QQQ (100-Nasdaq Largest Non-Financial) are still in the red for the year.
Our positions in energy and precious metal ETFs netted us a positive return, while our recent trades in the major stock index ETFs had already booked partial position profits, with the remainder of the positions stopping out for a small break-even profit.
As we experience record inflation numbers reported and central banks raising their lending rates, we are keeping our cash ready and closely monitoring key ETF sectors as compared to the major stock index benchmarks for clues regarding our location within the overall economic cycle.
SPY – SPDR S&P 500 ETF TRUST – DAILY SECTOR COMPARISON CHART
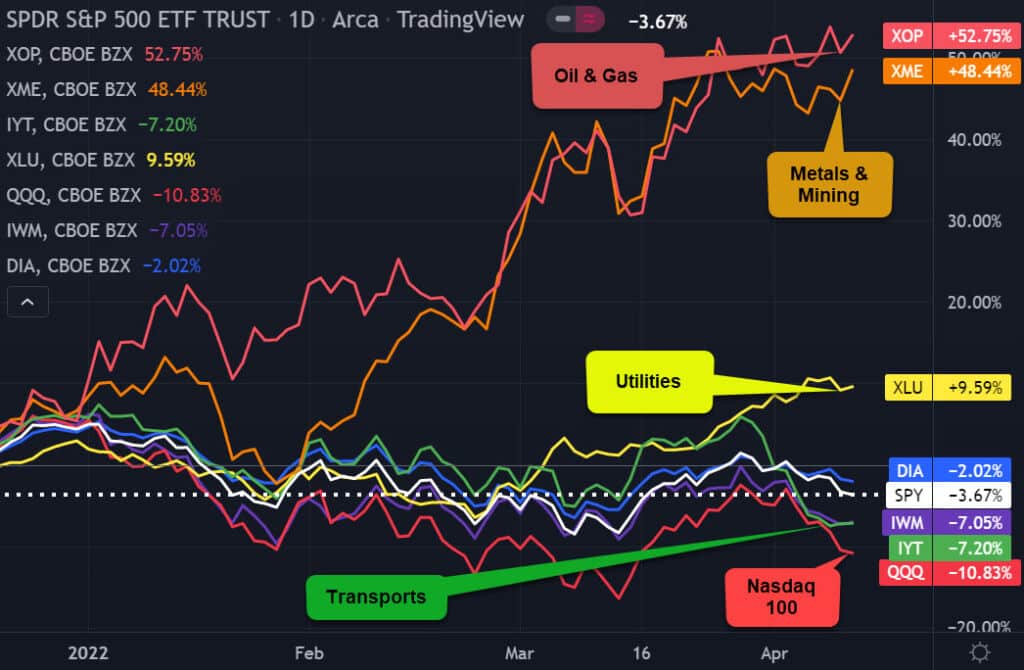
www.TheTechnicalTraders.com – TradingView
TACTICAL ETFs FOR ALTERNATIVE STRATEGIES
From time to time, we get questions from our subscribers regarding inverse and leveraged ETFs. Inverse and/or leveraged ETFs are not appropriate for everyone. However, for some experienced traders, these tactical ETFs can provide alternative strategies for use in a bear market.
An inverse ETF is an exchange-traded fund (ETF) constructed by using various derivatives to profit from a decline in the value of an underlying benchmark. Inverse ETFs allow investors to make money when the market or the underlying index declines, but without having to sell anything short.
A leveraged exchange-traded fund (ETF) is a marketable security that uses financial derivatives and debt to amplify the returns of an underlying index. While a traditional exchange-traded fund typically tracks the securities in its underlying index on a 1:1 basis, a leverage ETF may be structured for a 2:1 or even a 3:1 ratio.
These ETFs listed below track the underlying S&P 500 benchmark that represents 500 US large caps as selected by S&P’s Index Committee. These ETFs are examples of both inverse and leveraged ETFs:
- SPY vs. SH (1:1 or 1x leverage) – SPY (Bull) is the most recognized ETF and is typically listed in the top ETFs for the largest AUM and greatest trading volume. SH (Bear) provides 1:1 inverse exposure to the S&P 500.
- SSO vs. SDS (2:1 or 2x leverage) – SSO (Bull) seeks a daily 2x return of the S&P 500. SDS (Bear) provides 2:1 inverse exposure to the S&P 500.
- UPRO vs. SPXU (3:1 or 3x leverage) – UPRO (Bull) seeks a daily 3x return of the S&P 500. SPXU (Bear provides 3:1 inverse exposure to the S&P 500.
SPY – SPDR S&P 500 ETF TRUST – DAILY S&P 500 COMPARISON CHART
The following chart gives us a visual of how the ETFs mentioned above are performing against each other over the past 15-months. It should be noted that inverse ETFs carry unique risks that traders should be aware of before participating in them. Some of the risks associated with inverse ETFs are compounding risk, derivative securities risk, correlation risk, and short sale exposure risk.
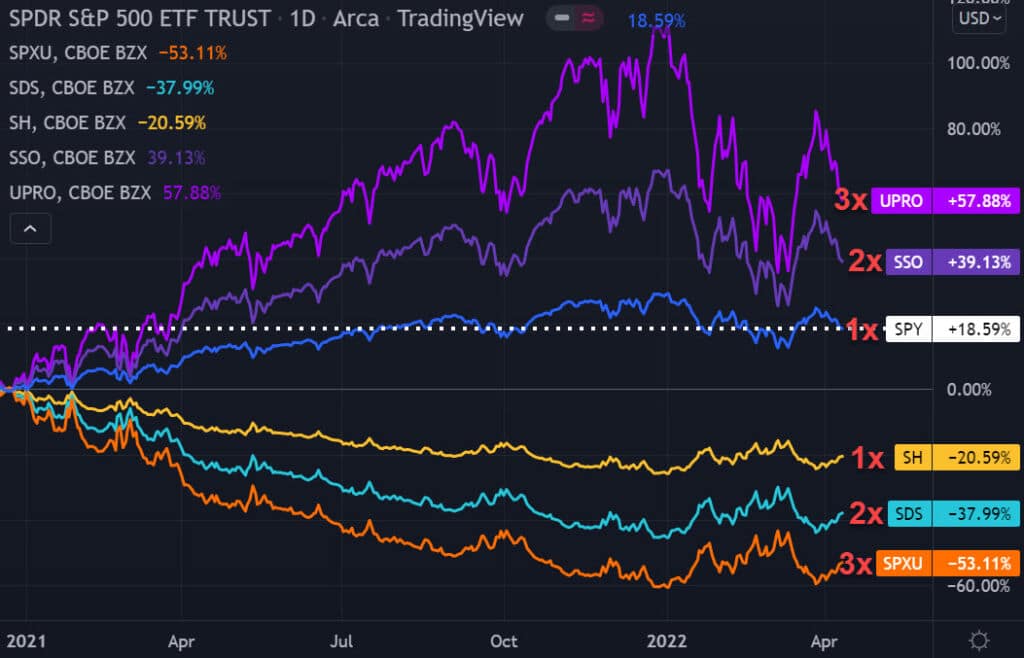
www.TheTechnicalTraders.com – TradingView
KNOWLEDGE, WISDOM, AND APPLICATION ARE NEEDED
It is important to understand that we are not saying the market has topped and is headed lower. This article is to shed light on some interesting analyses of which you should be aware. As technical traders, we follow price only, and when a new trend has been confirmed, we will change our positions accordingly. We provide our ETF trades to our subscribers, and in the last six trades we entered in March, all have now been closed at a profit! Our models continually track price action in a multitude of markets, asset classes, and global money flow. As our models generate new information about trends or a change in trends, we will communicate these signals expeditiously to our subscribers and to those on our trading newsletter email list.
Sign up for my free trading newsletter so you don’t miss the next opportunity!
Successful trading is not limited to when to buy or sell stocks or commodities. Money and risk management play a critical role in becoming a consistently profitable trader. Correct position sizing utilizing stop-loss orders helps preserve your investment capital and allows traders to manage their portfolios according to their desired risk parameters. Additionally, scaling out of positions by taking profits and moving stop-loss orders to breakeven can complement ones’ success.
WHAT STRATEGIES CAN HELP YOU NAVIGATE The CURRENT MARKET TRENDS?
Learn how we use specific tools to help us understand price cycles, set-ups, and price target levels in various sectors to identify strategic entry and exit points for trades. Over the next 12 to 24+ months, we expect very large price swings in the US stock market and other asset classes across the globe. We believe the markets have begun to transition away from the continued central bank support rally phase and have started a revaluation phase as global traders attempt to identify the next big trends. Precious Metals will likely start to act as a proper hedge as caution and concern begin to drive traders/investors into Metals and other safe-havens.
Historically, bonds have served as one of these safe-havens, but that is not proving to be the case this time around. So if bonds are off the table, what bond alternatives are there and how can they be deployed in a bond replacement strategy?
We invite you to join our group of active traders and investors to learn and profit from our three ETF Technical Trading Strategies. We can help you protect and grow your wealth in any type of market condition by clicking on the following link: www.TheTechnicalTraders.com
Chris Vermeulen
Chief Market Strategist
Founder of TheTechnicalTraders.com