Markets Rally Hard – Is The Volatility Move Over?
Many traders are watching the recent 3-day rally thinking “this is the end of the downside price move” and targeting new entry positions for the eventual upside price breakout. We’re here to warn you that our ADL predictive modeling system is suggesting we could see more volatility over the next 45+ days before a price breakout sets up.
Our Adaptive Dynamic Learning (ADL) predictive modeling system is something we like to keep away from public view for the most part. It is not something we share with the public often because it tends to show quite a bit of information about the future to skilled eyes. Today, you are going to get a glimpse of the ADL system on Weekly and Monthly TRAN charts to help you understand what to expect over the next 45+ days.
The ADL predictive modeling system is capable of learning from past price action and modeling “price DNA markers” based on a custom inference engine we created for this utility. That means it is capable of learning from any chart, any interval, any price data and any type of price activity while mapping the price data, technical data and corresponding future price activity into what we call and DNA price chain. After that mapping process is complete, we are able to ask it to show us what it has found and how current price bars align with the DNA mapping to show us what is likely for the future.
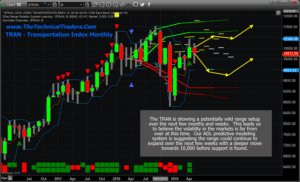
This Monthly TRAN ADL chart shows two ADL DNA Marker data points. The first data point, April 2018, consisted of 12 unique ADL price instances and suggests a moderate upside price bias may continue until near the end of July or early August 2019. August 2019 appears to be a “price anomaly” setup with a target price level near 10,000 for that month. Thus, August 2019, or any time +/- 30 days from that month, could be very volatile. The second data point originates from June 2018 and consists of 4 unique ADL price instances. The lack of ADL price instances (4 vs 12) is not as important as the predicted outcome of this DNA marker. ADL instances with small numbers of matching instances tend to be unique price data – something that is not seen in price that often and somewhat rare. This ADL data point is predicting a moderate upside price bias until June/July 2019, then the DNA marker is telling us that a downward price bias should start and that these future predictions do not have a strong probable outcome. This means August through November 2019 could be very volatile and result in unexpected price actions.
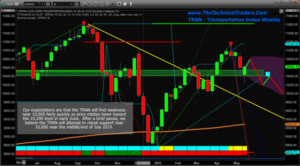
This next chart is a Weekly TRAN ADL chart that suggests 2 or 3 more weeks of moderate upside price bias before a big decline in prices headed into June 2019. If we follow the DASH lines on this chart and count the weeks going forward, it appears June 2019 will result in a moderate price decline toward the recent lows – possibly a bit lower. Then it appears the TRAN will stall near 10,200 – possibly moving a bit higher near the middle/end of July. After that, the ADL predictive modeling system is suggesting that the TRAN will break down below the 10,200 level and potentially head much lower – towards the 9,600.
The timing of this is interesting because it suggests the current US/China trade issues will not result in more price decline for the next 30+ days. Yes, we’ll like to see more price rotation, but the potential for a massive price decline over this span of time is rather muted. We may see a retest of the 10,200 level near Mid-June, but price should find support at that time and recover towards the 10,400 to 10,500 level near early July. Mid to End July looks very weak – where price may break aggressively lower, below 10,200 and attempt to target the 9,600 level.
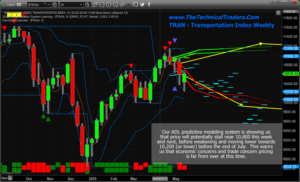
This next chart is a Weekly TRAN chart showing our Adaptive Fibonacci price modeling system. The Fibonacci price modeling system is one of our standard analysis tools. This utility is suggesting that price weakness may set up a Descending Flag formation over the next few weeks/months. This type of pattern suggests that a breakout move will result after the apex is reached. The YELLOW trend line on this chart may become a downside price target if our ADL predictions are correct and the TRAN price breaks down toward the 9,600 level or lower.
Take another look at the end of the first, Monthly ADL chart. See those YELLOW upside ADL arrows on the right side of the chart? Those are the current ADL predictions for October, November, December 2019. This prediction suggests that the Apex Breakout move at the end of the Descending Flag formation will be an upside price breakout sometime near the end of 2019.
Be prepared for another increase in volatility in Early June and Early/Mid July. Our predictive modeling systems are suggesting a breakdown in price will happen near these dates and this downside move should result in increased VIX/Volatility when the breakdown happens.
This does not appear to be the BIG CRASH that everyone is talking about. It appears to be a normal price pattern setup as weakness settles in and the TRAN appears to retest the 10,000 level (support) with the potential of moving slightly below this level.
We’ve just highlighted what our predictive modeling system is currently proposing will happen over the next 6+ months in the TRAN. If you know anything about the TRAN, you should be able to translate this into a trading road-map for the next 6+ months in the US markets. What is the value of having something like the ADL – being able to look into the future and see what is likely to happen 4 to 6+ months into the future? Visit www.TheTechnicalTraders.com to learn how we deploy these proprietary tools for our members to help them find and execute better trades.
This is proving to be an incredible trading year for traders who follow our trade alerts newsletter.
For active swing traders, you are going to love our daily trading analysis. On May 1st we talked about the old saying goes, “Sell in May and Go Away!” and that is exactly what is happening now right on queue. In fact, we closed out our SDS position on Thursday for a quick 3.9% profit and our other new trade started Thursday is up 20% already.
Second, my birthday is only three days away and I think its time I open the doors for a once a year opportunity for everyone to get a gift that could have some considerable value in the future.
Right now I am going to give away and shipping out silver rounds to anyone who buys a 1-year, or 2-year subscription to my Wealth Trading Newsletter. I only have a few left as they are going fast so be sure to upgrade your membership to a longer-term subscription or if you are new, join one of these two plans, and you will receive:

1-Year Subscription Gets One 1oz Silver Round FREE
(Could be worth hundreds of dollars)
2-Year Subscription Gets TWO 1oz Silver Rounds FREE
(Could be worth a lot in the future)
I only have a few more silver rounds I’m giving away
so upgrade or join now before its too late!
SUBSCRIBE TO MY TRADE ALERTS AND GET YOUR FREE SILVER ROUNDS!
Happy May Everyone!
Chris Vermeulen