Predictive Modeling Is Calling For A Continued Rally
We are constantly amazed that our Advanced Dynamic Learning (ADL) price modeling system has been incredibly accurate over the past 7+ months. Our researchers, at www.TheTechnicalTraders.com, called the early 2018 rally weeks in advance. We called the resistance levels and top in late January. We called a February 21~27 market top formation, called the market bottom on March 28, and last week called the market top to the hour and locked in 17.7% trading a simple 3x index ETF. Today, we are going to further illustrate the power and capabilities of the ADL price modeling system and what we are expecting over the next 7~10+ trading days.
Part of the power of the ADL price modeling system is the ability to see what the future may include as far as price targets and potential setups. When price mirrors the targets relatively closely, we assume the ADL predictions were accurate and that price is tracking the ADL predicted targets well enough to not expect many anomalies. But when price diverges from the ADL predicted targets by a wide range, we experience a “price anomaly” that indicates a very unique opportunity for profits. Think of these price anomalies as unusual price support or pressure causing price to deviate from the ADL predicted price targets for a short while. Price should, assuming that the ADL predicted price targets are like future price anchor points, attempt to move towards these future ADL price targets and may move towards them in an aggressive manner. When the anomaly sets up and the price range is substantial, it usually means that we have a fantastic opportunity for profits setting up as long as price attempts to recover towards the ADL price targets.
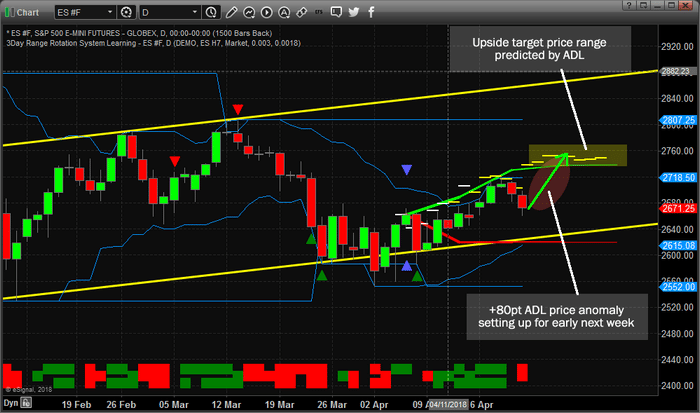
Here is our first example, the ES Daily chart. We’ve highlighted the price anomaly window with a dark red eclipse shape and you should be able to clearly see the +80 pt price gap that is setting up as of the close on Friday, April 20. If you follow the DASHed ADL predictive price targets on this chart, you will see that prices have been below most of these ADL price targets over the past two weeks and the most recent price levels were expected to drop a bit, but not as deep as the pullback extended today. This type of setup creates the anomaly pattern we look for as opportunity for a future upside, in this case, move. Our theory is that price will attempt to re-balance, or track back, to the ADL predicted price targets. This means we are setting up for a +80 to +100 pt upside move in the ES.
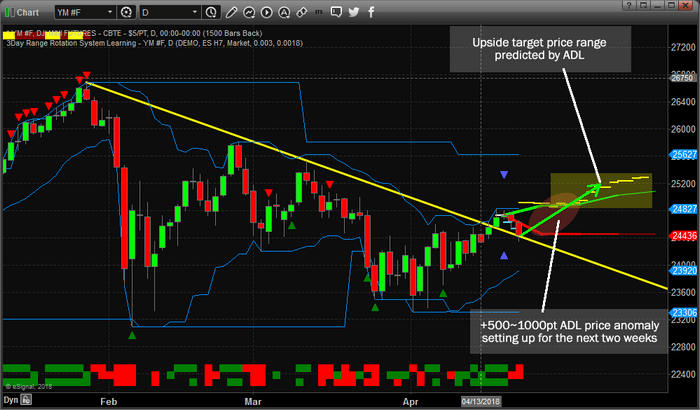
Additionally, the YM chart is showing a similar pattern with a similar ADL anomaly range. This chart should seem oddly similar to the ES chart. The ADL price modeling system is showing similar types of future price targets, yet the YM targets are slightly varied from the ES targets. The ES is expected to rocket higher over the next 2~5+ days where the YM appears to track an immediate +400~500 pt upside move, then stall for a few days, then continue higher for an additional +400~500 pts. You should be able to see this setup by tracking the YELLOW DASHed ADL predictive price targets on this chart.
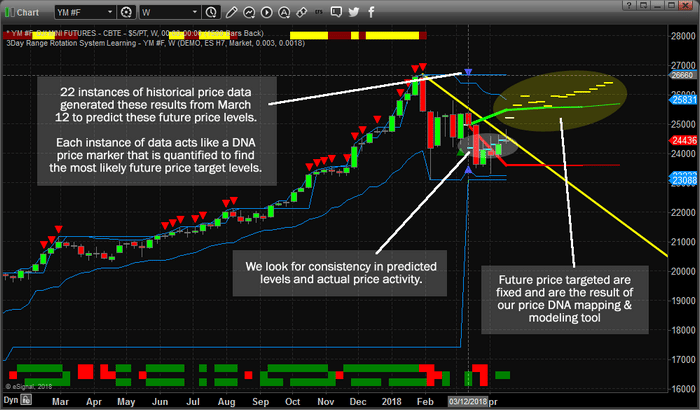
 We’ll close our this research with a YM Weekly chart to more clearly illustrate what the ADL price modeling system is suggesting for the extended future. Remember, these ADL predicted price targets go all the way forward to the end of July, 2018 – nearly 3 months into the future. Yes, we can attempt to see well into the future with the ADL price modeling system and as long as we continue to refresh our analysis for newer, more recent ADL events, we should be able to accurately map out the future of almost any market.
Yet, what is interesting about this Weekly YM chart is that the ADL predictive analysis modeling system took data from 22 historically similar instances of price/technical data, which we call Price DNA mapping, and attempted to predicted the future price targets based on all of this data that tracked quite well over the past 5~6 weeks. If you study the DASHed levels on this chart, you’ll see that prices tracked these predictive levels almost perfectly over the past 5+ weeks and that the future predicted price targets are all substantially higher than the current price level. In this case, on this Weekly YM chart, it appears the upside ADL price target levels are +1000~1800 pts higher than the current price. That would be a fantastic move for LONGs if this move happens.
Yes, the same Daily YM ADL price anomaly is setting up with a +1000 Daily price target, yet the Weekly ADL modeling chart shows us that this upside move may actually be far greater than we expected from the Daily chart. What should a trader do with this type of information?
That’s right, traders should understand this is an opportunity for a potentially immediate upside move beginning early next week in the US majors. We believe many traders did not want to hold positions over the weekend after the Syria events last weekend. We believe last weeks selling was a “washout low” psychological event that is not related to fundamental price dynamics. We believe in our ADL system because it has proven to be extremely accurate over the past 7+ months and we believe this move will execute just as we have described in this research post.
With that said, these broad based market predictions are not nearly as easy to trade and profit from as you think. The fact is, the market has a way to shake you out of positions just before the move you expect to happen takes place. The market manipulates and takes advantage of emotional traders to the extreme.
If you want to know how to take advantage of these moves and profit consistently from the markets, then visit www.TheTechnicalTraders.com to learn how we help our valued subscribers find and execute success every week. These types of tools are only one component of what we offer our members – we also offer Daily video analysis of the market, advanced research posts, Daily updates and more. We know we are the only research team that can offer you these types of advanced predictive modeling systems and you can see the value we can offer you. If you have ever wanted to know what the markets are going to do with relative certainty, then you owe it to yourself to see how we can help you see opportunities more clearly. Visit www.TheTechnicalTraders.com today.
ABOUT TECHNICAL TRADERS LTD:
53 years experience in researching and trading makes analyzing the complex and ever-changing financial markets a natural process. We have a simple and highly effective way to provide our customers with the most convenient, accurate, and timely market forecasts available today. Our stock and ETF trading alerts are readily available through our exclusive membership service via email and SMS text. Our newsletter, Technical Trading Mastery book, and 3 Hour Trading Video Course are designed for both traders and investors. Also, some of our strategies have been fully automated for the ultimate trading experience.