Part II – Global Central Banks Kick Can Down The Road Again
As we continue to explore the events of the past 10 to 20+ years and how the global central banks continue to attempt to navigate through these difficult times, we want to take a few minutes to try to understand and explain how the capital that has exploded into the global markets has been deployed and used to chase returns, risk and opportunity and may continue to be deployed more efficiently going forward.
Read Part I of this series here: https://thetechnicaltraders.com/global-central-banks-move-to-keep-the-party-rolling-onward/
The recent news that the global central banks may begin a new round of stimulus and easing got us thinking – “what next?”. Over the past 10 to 20+ years, global central banks have attempted to prompt an economic recovery that seems to slip past economic planners and we believe that is because core functions of the global economy are weaker than many expect. We’re going to try to explore some of these factors and prepare traders for what may come in the future months.
Much of the capital that was dumped into the markets was deployed into the global equity markets as investments in emerging markets, capital markets, and the US stock market. As much as everyone wants to think this capital went into infrastructure and other essential investments, much of it went into the only thing that was capable of generating an easy return with limited risk – the global stock market.
At first, after 2008, we saw an immediate jump in emerging markets. This sector of the global economy had been hard hit by the collapse in 2008-09 and an incredible opportunity existed because of a price anomaly that was created near the bottom in 2009. Emerging markets were recipients of some capital when the central banks began to infuse money into the system, but their equity markets were uniquely positioned for advancements because of the pricing levels after the crash.
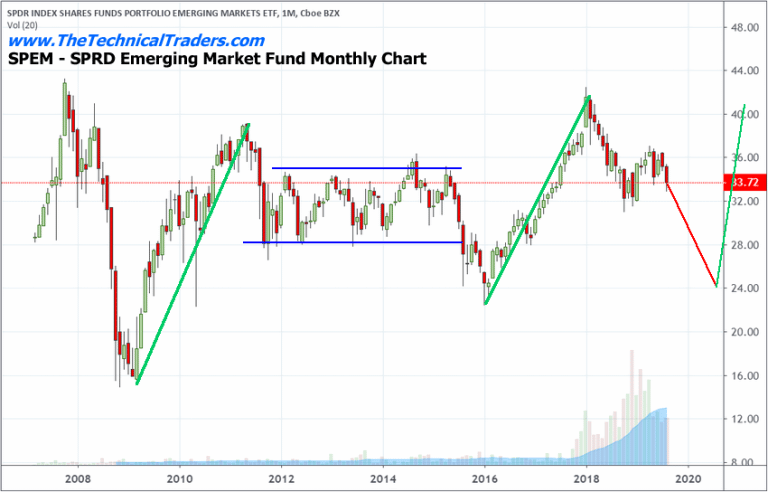
The SPEM chart below highlights the recovery in the emerging market that took place almost immediately after the bottom formed in 2009. We can clearly see the immediate price advance and the resulting sideways price action after 2011. Once this sector recovered up to previous 2007 levels, there was really nothing else to push it much higher.
Traders should also take notice of the rally in 2016 and 2017. This rally was based on forward expectations that renewed interest in emerging markets would result in increased returns. These aligned with expectations resulting from the US Presidential election (2016) as well. This price advance consisted of a +86% price advance from $23 to $42. Could it happen again?
We believe the next phase of the global market recovery will result in a similar type of price advance after new lows are established in emerging markets. Skilled technical traders should continue to plan for and prepare for this type of setup once emerging markets complete a process of exploring lower lows to form a bottom. This process should complete just before the 2020 US presidential elections and will likely result in another price anomaly setup where the price is well below expected asset levels (extreme pessimism) and will set up as an incredible +40% to +80% upside potential as renewed optimism and the continued transitional process of the global economy persists. Traders just need to wait for the setup – then execute their trades.
The continued process of how capital rolls from one environment to another in search of returns is something we have attempted to explain in detail over the past months. We call it the “capital shift” process. Our belief is that capital (cash) is always hunting for suitable investments in various forms and continues to shift from one environment (market segment) to another as opportunities (ROI) and risks (healthy investment environments) change. So, think of capital as a migratory asset that continues to shift into and out of various segments of the market as opportunities and risks present themselves.
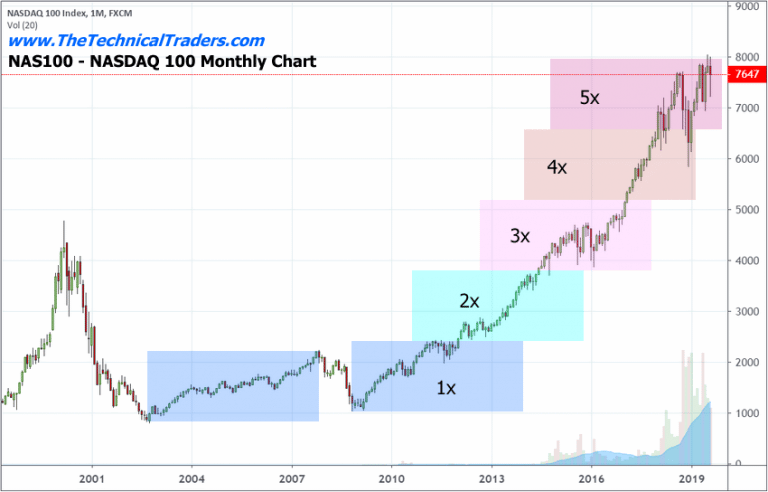
One of the biggest benefactors of the quantitative easing and central bank policies of the past 10+ years has been the US equity market. Take a look at this NAS100 chart to see what we mean.
When we take into consideration the post 9/11 market rally in this NAS100 chart (highlighted by the blue rectangle) we can see that, at that time, the capital was focused away from the US markets because other foreign markets were better positioned in terms of ROI and risk. Even though the US was engaging in moderate QE processes to recover from a moderate economic crisis, a price advance in the NAS100 was muted – nothing like the right side of this chart.
The post-2009 advance in the NAS100 is a completely different story. The technology sector in the US had shifted away from a heavy risk factor and into a “unicorn” mode by 2012/2013. This shift in the investment environment meant that global traders saw the US technology market (NAS100) and an excellent opportunity for capital deployment. As more and more cash poured into the NAS100 chasing these gains, prices continued to skyrocket higher. What next?
Unless the dynamics of this market shift away from expected gains or the US Dollar weakens dramatically, we believe the US stock market will continue to experience some volatility and continued price advancement while capital waits to see what happens throughout the rest of the global market.
We do believe the increased volatility of the past 2 years highlights an extended risk for rotation over the next 2+ years and we believe a move lower may be something we have to prepare for as the 6000 level has already been established as support. Therefore, we are not suggesting the NAS100 will go straight up from here. We are suggesting that unless something dramatic happens to change the economic environment, the US markets will continue to be viewed as opportunistic by global investors and that dips in price, even big ones, will likely respond with a nearly immediate recovery in price – even if a dip were to happen well below the 6000 level.
Once the economic environment shifts away from opportunity in the US, then all bets are off in terms of downside risk – if this ever happens.
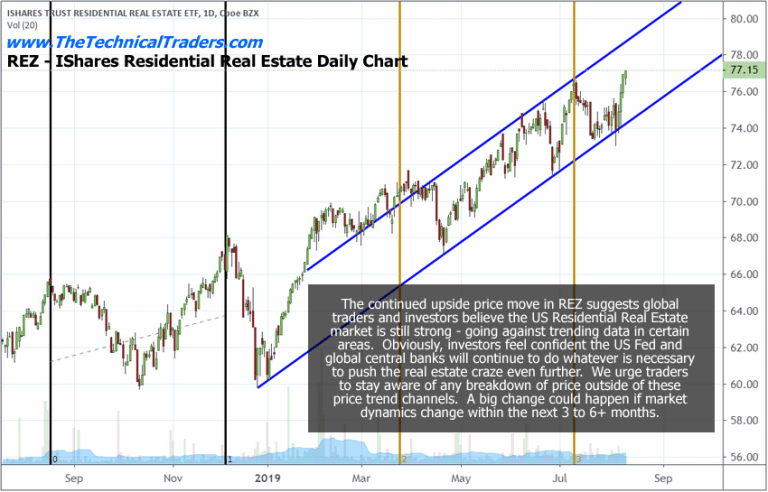
Another factor that everyone must be aware of is Real Estate. Recently, US real estate has continued to rally as rates have continued to maintain some level of affordability throughout most of the US. Certain areas have gotten very un-affordable and these markets are already experiencing a pricing reversion where prices are declining as sellers attempt to attract buyers at high prices. Overall, though, the health of the US real estate market is still moderately strong.
One thing that we would be concerned about is a perceptional shift away from buying if the US Fed and global central banks engage in new stimulus processes. Consumers may view this process as a warning that some concern is underlying the efforts of the central banks and hold off on buying real estate while they wait to see what happens after the US 2020 elections. We believe this may already be happening right now.
CONCLUDING THOUGHTS:
The REZ real estate ETF continues to push higher as pricing becomes an issue and sales levels continue to support a fairly active market. We are concerned that a sharp change in perception could be taking place over the next 12+ months as fears of a change in US political leadership may thwart or diminish some forward expectations. Investors need to pay attention to all aspects of the markets in order to prepare for future opportunities and price moves.
In Part III of this article, we’ll look into some of the fundamental elements of the US and global economies and how the past actions of the US Fed and global central banks may have set up the global markets for the bigger price rotations we are expecting over the next 12 to 24+ months.
Also, takes a look at today’s charts compared to the 2008 market top and I can’t warn enough that the next financial crisis (bear market) is scary close, possibly just a couple weeks away. See Scary Bear Market Setup Charts.
FREE GOLD OR SILVER WITH SUBSCRIPTION
TO PREMIUM TRADE SIGNALS!

Chris Vermeulen – www.TheTechnicalTraders.com