Post-Covid Stimulus Payouts & The US Fed Push Global Investors Deeper Into US Value Bubble – Part II
In this second part of our research into how capital is being deployed across the globe and why traders/investors continue to pour capital into the US equities markets, we’ll explore how the US major indexes have reacted to the continued investments by the US and foreign investors compared to foreign market trends.
Using methods like this to determine where capital is being allocated and why traders/investors decide to move capital into and out of various global indexes, suggests one of the most important aspects of swing trading is to stay keenly aware of how capital is moving and deploying across the globe.
In October of 2019, we attempted to highlight how capital is shifting and how trends are setting up in currencies, global major indexes, and other global sectors.
October 17, 2019: CURRENCIES SHOW A SHIFT TO SAFETY AND MATURITY – WHAT DOES IT MEAN?
While reviewing our past research posts, we found this one particularly interesting because it was posted only 4 months before the COVID-19 peak and indicated our long-term predictive modeling system suggested a volatility surge may take place in late 2019 or early 2020.
October 29, 2019: LONG-TERM PREDICTIVE SOFTWARE SUGGESTS VOLATILITY MAY SURGE
Even though our predictive modeling system can’t attempt to predict unknown outside global events, like COVID or wars, it can make some really uncanny and accurate predictions related to price activity and volatility in the markets that come true.
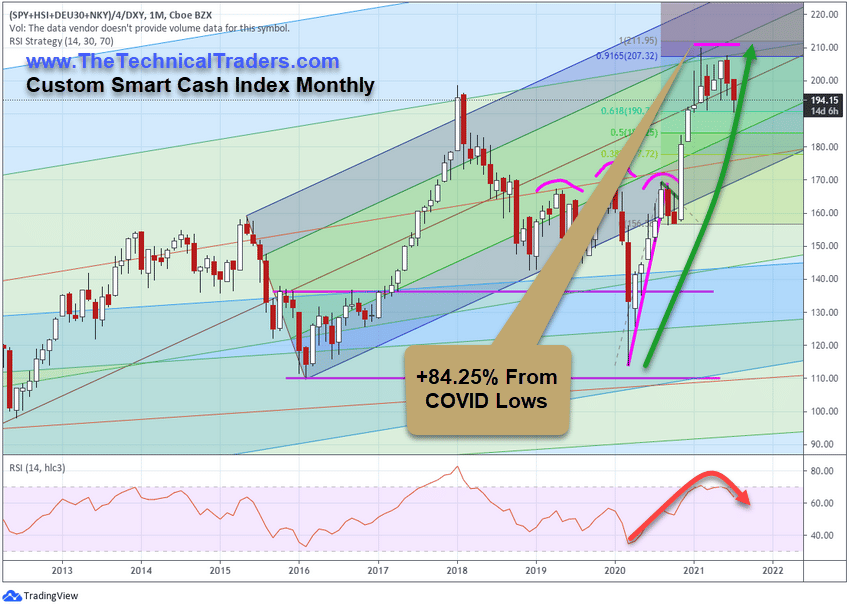
Global Custom Smart Cash Index Continues To Flatten
This first chart shows our Custom Global Smart Cash Index Monthly Chart. The point we want you to focus on with this chart is the sideways and weaker price action over the past 6+ months as well as the +84.25% rally from the COVID lows.
This chart reflects a fairly even and global response by traders after the March 2020 COVID lows to expect a global reflation rally bringing global indexes back up to the pre-COVID-19 peaks. In this case, that rally phase completed by September/October 2020. After the November 2020 US elections, a second rally phase was initiated that pushed the Custom Global Smart Cash Index to recent highs (near $210). These current highs represent a new high price valuation level, even higher than the 2018 peak levels, which suggests that large amounts of capital shifted back into the global markets after the November 2020 election.
Sign up for my free trading newsletter so you don’t miss the next opportunity!
Currently, though, this chart shows a broad sideways weakening price trend that may suggest an early stage peak has setup – similar to the peak in 2018. As capital seems to be fleeing the global market indexes and sectors, it is likely to move away from risks related to this inflated secondary rally phase and into assets that provide better safety and security.
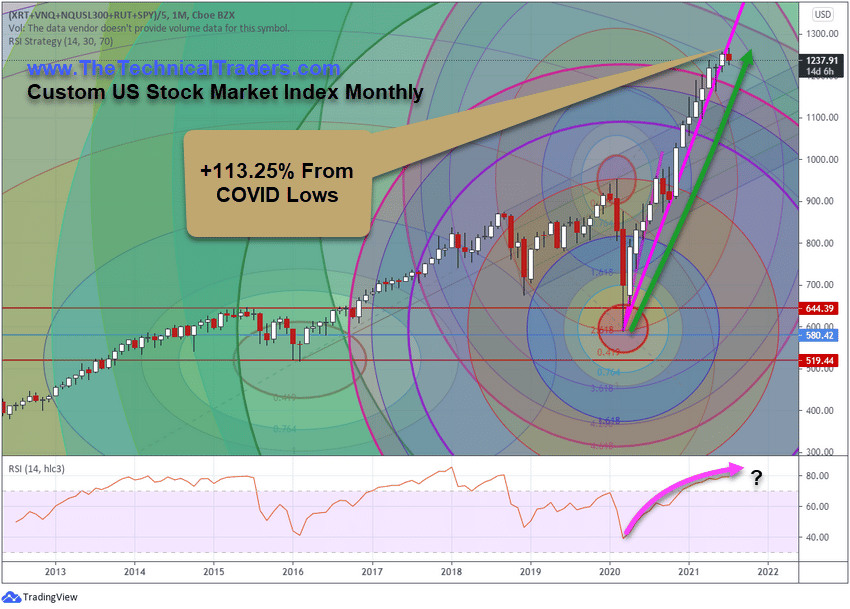
Custom US Stock Market Index Chart Shows A +34.42% Greater Rally Than Global Index
This second Custom US Stock Market Index chart shows an incredible rally phase after November 2020 that includes an additional +34.42% extended rally to the current $1266.42 highs. Comparatively, the Custom US Stock market index, which includes the NASDAQ, Russell 2000, SPY, Real Estate, and Retail Sales, highlights the incredible strength and resilience of the US economy and consumer over the past 12+ months. While the Global Custom Index has stalled over the past 6+ months, the US Custom Index has rallied an additional 13.5% higher.
At this stage of the rally, though, we need to see the Custom US Stock Market Index find support above the May 2021 lows, near 1164.38, and attempt to setup a new momentum base for any further upside price trending. The fact that the Global Custom Index is weakening while we’ve seen a fairly broad breakdown in commodities and the Russell 2000 recently suggests this extended rally may be pausing.
Normally, price moves in a rotational manner setting up new peaks and troughs as it trends. Recently though, the continued stimulus and global central bank actions have prompted a type of rally that we’ve not seen in many years – a hyper speculative rally based on expectations of very strong economic and recovery trends. As this phase of the post-COVID rally phase completes, the next phase may be much more difficult for traders to navigate going forward.
Post-COVID Recovery Cycles Will Change How Capital Seeks Opportunities In The Future
Recently, I shared a new research article related to the “Transitory Inflation” expectations that have been stated by Jerome Powell, and others, and how traders need to prepare for fairly broad rotations in the recovery data over the next 12 to 24+ months.
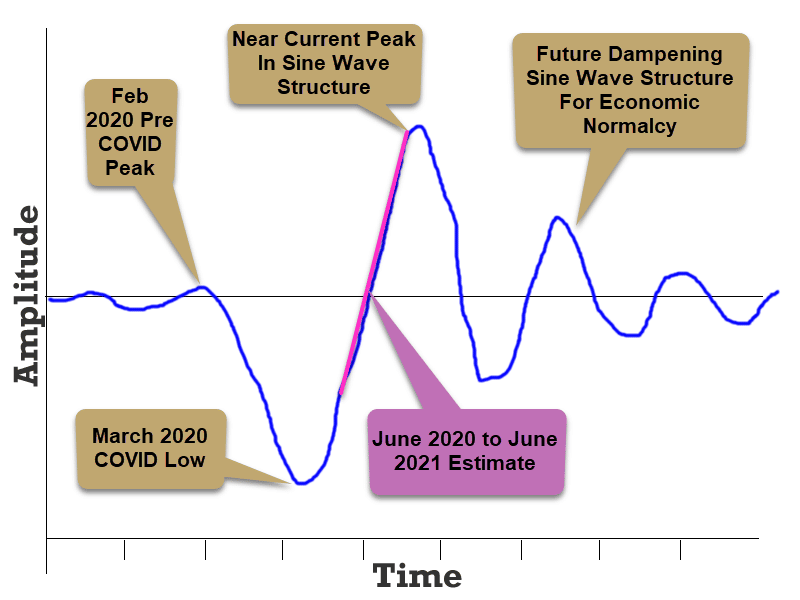
I strongly believe the global markets are going to contract into a sideways, slightly downward trend before the end of 2021 in alignment with the post-COVID cycle phases. Over the next 8+ months, my analysis of these phases suggests we will start to see weaker economic data, weaker consumer engagement, and eventually, the potential for another round of moderately negative economic data as the Month-over-Month and Year-over-Year data transitions into lower/weaker representation of the cycle phase (see the chart above).
Given the amount of capital deployed throughout the globe and within the US equities markets, this may prompt a series of fairly large price rotations over the next 18 to 24 months (or longer) and may not settle until after 2024. What the global central banks do, or don’t do, over the next 24+ months could compound these cycle phases and trends.
More than ever, right now, traders need to move away from risk functions and start using common sense. There will still be endless opportunities for profits from these extended price rotations, but the volatility and leverage factors will increase risk levels for traders that are not prepared or don’t have solid strategies. Don’t let yourself get caught in these next cycle phases unprepared.
Want to know how our BAN strategy is identifying and ranking various sectors and ETFs for the best possible opportunities for future profits? Please take a minute to learn about my BAN Trader Pro newsletter service and how it can help you identify and trade better sector setups. My team and I have built this strategy to help us identify the strongest and best trade setups in any market sector. Every day, we deliver these setups to our subscribers along with the BAN Trader Pro system trades. You owe it to yourself to see how simple it is to trade 30% to 40% of the time to generate incredible results.
As something entirely new, check out my new initiative URLYstart to learn more about the youth entrepreneurship program I am developing. This is an online program of gamified entrepreneurship designed to introduce and inspire kids to start their own business. Click-by-click, each student will be guided from their initial idea, through the startup process all the way to their first sale and beyond. Along the way, our students will learn life lessons such as communication, perseverance, goal setting, teamwork, and more. My team and I are passionate about this project and want to reach as many kids as possible!
Have a great day!
Chris Vermeulen
Chief Market Strategist
www.TheTechnicalTraders.com