US Stock Market Enters Parabolic Price Move – Be Prepared, Part I
After the recent COVID-19 virus event and the global market concerns that will warrant caution for skilled traders and investors, the US stock markets have entered an upside parabolic trend that will likely end with a massive price collapse – extremely volatile and aggressive in nature. Our research team continues to warn of the unpredictable nature of the current price rally and the fact that the upside parabolic price trend appears more prominent in the NASDAQ sector. If history has taught us anything, it is that these types of parabolic moves can last a while and that they always end in a deep downside price correction – usually 61% to 75% of the last upside price trend.
Our research and trading team has been advising friends and followers to stay very cautious of the current markets (excluding Gold, Miners, and certain other protective sectors). We don’t believe this rally warrants any exposure greater than 15 to 20% given the current global economic environment and the hyper-parabolic nature of the current price move. We believe the opportunity presented by the upside advances does not negate the potential risks of a massive collapse event taking place in the near future. In other words, we’re more cautious of how ugly and aggressive the end of this parabolic move will be than willing to try to find some opportunities in an already hyper-extended parabolic upside price trend.
Still, there are opportunities to be had in this trend for skilled short-term technical traders. A number of sectors continue to perform quite well and using proper position sizing for trades may allow for quick targets of 5% to 10% or more. We urge all of our friends and followers to be cautious of the current rally in the markets as we’ve only seen this happen three other times over the past 100 years: 1927~29, 1986~87, 1996~99. The collapse after the 1929 peak resulted in a 90% decline in prices. After 1987, the markets collapsed by nearly 36%. After the DOT COM market peak in 1999, the markets collapsed near 51%. Are the markets preparing for a massive collapse event right now with this hyper-parabolic upside price trend?
NASDAQ MONTHLY CHARTS
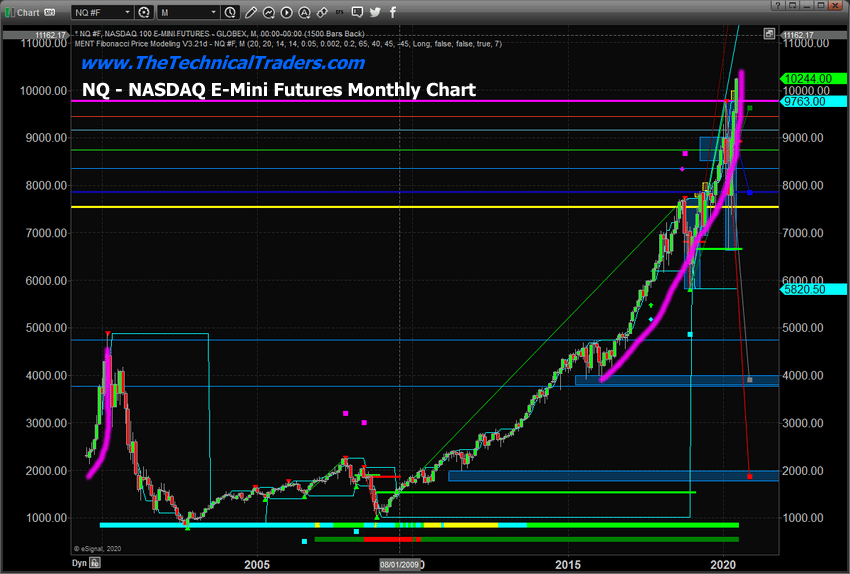
This monthly NQ, NASDAQ E-Mini Futures, chart highlights the upside parabolic price move that is currently taking place. It also highlights the similar type of price movement that took place in the late 1990s. In theory, the buying power driving the markets higher can last more than 12 to 15 months in some cases. Prior to the peak in 1929, the parabolic move started near June 1926 and peaked in July 1929 – approximately 3 years. In 1986, the rally in price was shorter – only lasting from November 1985 to August 1987 – about 21 months. The rally to the DOT COM peak in 1999 started near March 1995 and lasted a total of approximately 51 months (just over 5 years).
The current rally, as we identify the start of the parabolic price trend, started after the 2015~16 sideways price range. Our research team considers the start of this current upside move as initiating near July 2016 and continuing through to today – totaling almost 4 years in length. If we discount the 2015~16 sideways price channel and consider the 2012 to 2020 Fed-induced price rally as the “total scope” of the parabolic range, then we can easily total more than 7 years into this incredible parabolic price move. This move is truly unlike anything we’ve seen in the recent history of the US stock market – and the crazy component to all of this is it is happening at a time when the global markets have just been derailed by a global virus pandemic.
What comes next? Well, if history is any teacher – a peak in price sets up, volatility starts to explode and a collapse in price initiates at some point in the future that completely deflates the bubble.
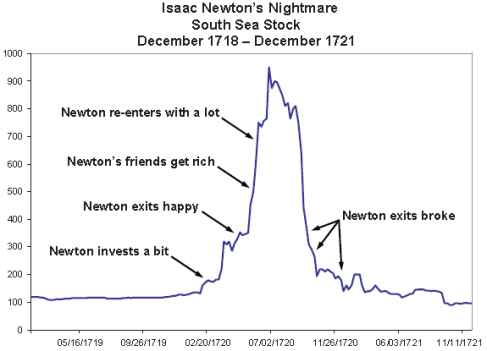
The most prominent example of a price bubble that many traders are familiar with is the story of the South Sea Company (1719 to 1721). Prior to the peak in this bubble story, the South Sea Company began as an act of English Parliament (source: https://engl3164.wordpress.com/2012/10/31/the-south-sea-bubble/ ). As stated from our source…
At this time, the English government was deeply in debt. Harley, the Earl of Oxford, came up with a scheme to free England of this debt while capitalizing on what was perceived as a largely untapped gold and silver market in South America. Harley proposed that Parliament could create an independent company that would assume all of England’s debt and, in exchange, would be able to charge the government yearly interest until the original sum was repaid. The company would be able to afford to assume this debt because England would grant it a monopoly on trade from South America. The company would prosper, English influence would be extended further into the New World, and the English government would become free of debt. This plan was so popular that it was called “the earl of Oxford’s masterpiece” (Carswell, 1969).
It took several years to form the company and work out the details of the agreement. By 1720, the South Seas Company was formed and received £30,981,712 in debt from the English government in exchange for a promise that the English government would pay £600,000 per year interest. However, the plan had already begun to show major weaknesses, even before taking on this huge debt. The success of the plan rested on the assumption that a monopoly on English trade with Latin America was worth almost limitless profit. Certainly, Spain was enjoying great profit in extracting gold and silver from this area. Yet a major problem was that Spain owned the rights to South American trade and would allow England only one ship’s worth of trade per year for the entire continent and only on the condition England pay 25% of the profits to Spain in addition to a 5% tax. Even this small concession ceased entirely in 1718 when England declared war on Spain (Carswell, 1969).
We want all of our readers to understand the psychological aspect of this past bubble – the idea that the plan could not fail and would provide almost limitless success if executed as planned set off a “no fear rally” that eventually resulted in a massive price bubble.
The next major point that is critical to the understanding of how a price bubble function is the following statement from the same source…
Regardless of the fact that the South Seas company was an unproven company already sunk deeply in debt, with no realistic prospects of profit, it was perceived as an almost infallible opportunity. As with all economic bubbles, the public’s perception of its potential was far greater than its actual value. For this reason, stock prices soared. Modern economists have argued that some investors may have been fully aware that this was an artificial market that was bound to fail. However, realizing that stock prices would continue to climb until the bubble burst, it would still have been profitable to buy stock with the intention of selling before prices inevitably plummeted (Temmin and Voth, 2003).
What could go wrong with this plan for investors? It seemed as if nothing could fail – there was almost no risk and everyone had incredibly high expectations of future success and profits… Then, more good news for traders and investors.. More shell companies promising future greatness to continue to hype the markets…
Unfortunately, investors in the South Seas Company were not the only individuals to lose money during this time. Many businessmen, realizing the potential for profit in such an artificial market, began similar schemes to create companies with inflated stock prices. Hundreds of companies were formed within only a few months, with thousands of individuals rushing to buy stock. Ultimately, these companies went the way of the South Sea Company. Countless investors lost fortunes while many dishonest market speculators became rich (Carswell, 1969).
(Source: https://engl3164.wordpress.com/2012/10/31/the-south-sea-bubble/ )
Eventually, when reality set back into the minds of these investors, many had lost entire fortunes, families, and futures. Some of these company founders were hunted down and killed because of the anger and frustration of many investors and others. The reality of the situation is that nothing is without risk – just like the stock market valuations today.
Before you continue, be sure to opt-in to our free market trend signals
before closing this page, so you don’t miss our next special report!
In the second part of this research article, we’ll continue to explore the potential price bubble that is setting up in the US and global stock markets as a result of the US Fed and global central banks pushing speculative investments into the global equities markets (primarily the US stock market). It is essential that all skilled traders and investors learn to understand what is happening and to understand the severe risks that are currently in play in the markets right now. Stay cautious, stay protected, and stay safe.
Get our Active ETF Swing Trade Signals or if you have any type of retirement account and are looking for signals when to own equities, bonds, or cash, be sure to become a member of my Passive Long-Term ETF Investing Signals which we are about to issue a new signal for subscribers.
Chris Vermeulen
Chief Market Strategies
Founder of Technical Traders Ltd.