US Stock Markets Setting Up For Increased Volatility
The US stock markets took a nosedive early in the regular trading session after the QQQ briefly advanced to new All-Time Highs this morning. With the QQQ and other symbols nearing fresh new highs, traders should expect volatility to increase as trading systems and traders to look for any signs of a top to set up. As we start to cross into “new high territory”, some fear starts to come back into the markets and volatility is sure to increase.
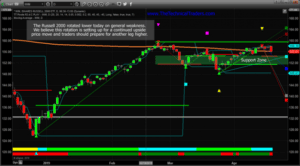
The Russell 2000 took a pretty big hit today as you can see from the chart below. This move lower is still well within our proprietary Fibonacci modeling system’s bullish parameters and we’ve highlighted a “Support Zone” for our followers to understand where real price support is located. Any downside move below $152 would cause us to reconsider our bullish trend position, but right now this is nothing more than price rotation. Wait it out and look for opportunities when it bottoms.
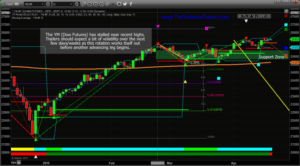
The YM (Dow Futures) Daily chart, below, highlights just how fractured the US stock market really is today. While the Russell 2000 is rotating lower quite hard, the DOW futures are relatively FLAT and still trading near the recent highs. This fracturing of the major indexes suggests money may be moving away from sectors/symbols that traders may interpret as risky at the moment – and into symbols that are more stable. For example, we might find that Financials and the Russell 2000 symbols may present a relatively high level of fear that a downside rotation in these sectors may be bigger and more dramatic than in the NQ, ES or YM.
Still, our advice is to watch this move and wait it out a bit. Our “Support Zone” for the YM is clearly highlighted with the Green Box on the chart.
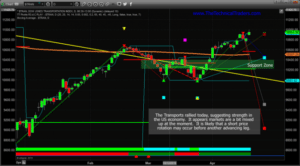
Lastly, we want to highlight the Transportation Index for all of our followers to understand what is going on behind the scenes today. The Transportation Index is a fairly strong measure of future economic activity and output. It typically leads the US stock market by at least 20~30 days. The price advance, today, in the Transports would indicate that many traders believe the US economy is still improving and will still continue to perform well. If the Transports break to new highs, then we should see more continued upside price levels in many of the US stock market sectors.
Again, the markets are a bit fractured today with price action. And that leads us to believe we could see a spike in the VIX and volatility over the next few days/weeks while this rotation plays out. Eventually, we believe a continued upside price leg will resume and we want to urge traders to play it safe for right now. Follow our “Support Zones” as a key indicator for when the price has fallen into a potentially risky level – below support. If this happens, then we would begin to become concerned that price may be initiating a bigger move to the downside.
Get my daily analysis and swing trade alerts at my Wealth Trading Newsletter and become a technical trader today!
Chris Vermeulen
www.TheTechnicalTraders.com