Will 2022~23 Require A Different Strategy For Traders/Investors? Part III
Is The Lazy-Bull Strategy Worth Considering? – Part III
This last part of our multi-part article compares trading styles amidst the increasing price volatility and extended hyperbolic trending. We’ll explore what we’ve witnessed in the US markets over the past 5+ years and highlight what to expect throughout 2022. Additionally, we’ll highlight and feature the strategic advantages of our advanced Lazy-Bull strategies.
Lazy-Bull Rides Big Trends & Avoids Excessive Risks
Many people are inherently opposed to the Lazy-Bull strategy because they’ve been conditioned to think trading requires actively seeking various opportunities every week. We don’t quite see it that way. Instead, we see the opportunity for growth and consistency existing in taking 4 to 12+ strategic trades per year while the markets set up broad momentum moves/trends. Our objective is not to trade excessively just for the sake of trading. Instead, we want to take advantage of when the markets enter opportunistic periods of trending and ride those trends as far as they go.
Sign up for my free trading newsletter so you don’t miss the next opportunity!
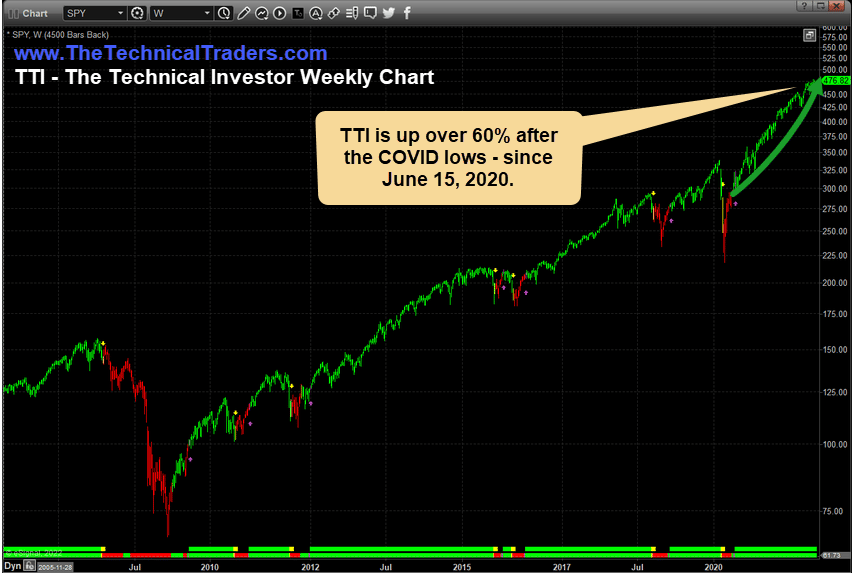
This example Weekly SPY chart showing our TTI trading strategy highlights the growth phases in various trend stages. Notice the GREEN and RED sections on this chart where our system has identified directional changes in the major price trends. Over the past 11+ years, there have been numerous bullish price trend phases resulting in 12 months to 36+ months bullish price trend trends. These major price cycles make up part of the advantage of the Lazy-Bull strategy.
We are not actively seeking the strongest stock symbols throughout these trends. Instead, we are simply relying on the strength of the US major indexes to carry our trades further into profits as the market’s trend. The TTI strategy is a “set it – and forget it” type of strategy until the strategy generates a new entry or exit trigger.
Volatility & Price Rotation Make 2022 More Dangerous Than 2021 – What Next?
Our research shows 2022 will likely continue to exhibit increased price volatility and bigger price rotation. Meaning 2022 could be very dangerous for shorter-term strategy traders as volatility levels may disrupt traditional stop boundaries or other aspects of their defined strategies.
It is important to understand how and when these issues creep into a strategy and attempt to move above these issues.
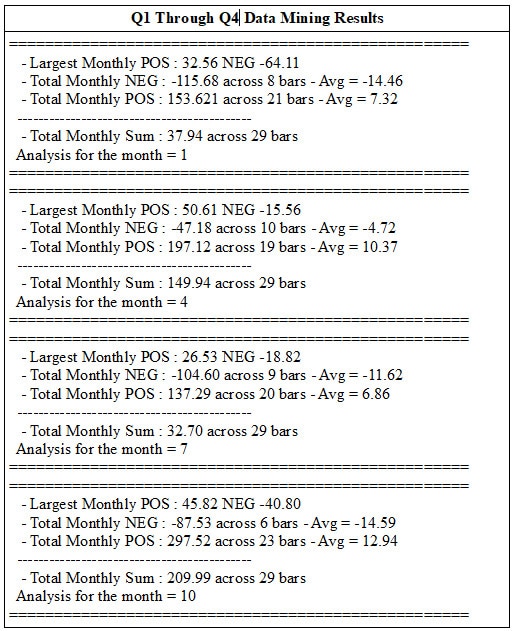
Looking at the Q1 through Q4 data using our proprietary Data mining utility, I’ll give you my insight related to the data and what I believe is likely to happen in 2022. Remember, this data consolidated the past 28-29 years of trends in the SPY to present these results – going back to 1993. That means that this data is compiled through several various price trends, major market peaks, major market bottoms, and various volatility levels along the way.
Q:2022 Analysis
Q1 data suggests an overall positive/upward price trend is likely in 2022, with the Total Monthly Sum across 29 years totaling 37.94. Broken into annual gains, that translates into an expected $1.30 gain in the SPY in Q1:2022.
The Total Monthly NEG (negative) range appears to be more than double the Total Monthly POS (positive) range. However, we may see some price volatility in Q1:2022 that surprises the markets. For example, maybe the US Fed makes surprise rate increases? Perhaps it relates to some other foreign market event disrupting the US markets? I don’t know what it will be, but I feel some market event in Q1 is likely, and this event may prompt a fairly large downward price rotation in the SPY.
Overall, I believe Q1:2022 will end slightly higher than the end of Q4:2021 levels and may see the SPY attempt to break above $490~500 on stronger earnings and continue the market’s bullish price phase.
Q2:2022 Analysis
The second quarter seems a bit more stable in overall price appreciation trends. The data shows a shallow NEG value compared to a moderately strong POS value for Q2. Because of this, I believe the second quarter of 2022 will slide into a relatively strong upward Melt-Up type of trend after a potentially volatile Q1:2022.
The Total Monthly Sum value is higher in Q2 than in Q1, suggesting Q2 may exhibit a stronger upward momentum as a more apparent trend direction sets up after the Q1 volatility.
The US Fed will likely attempt to aggressively reduce its balance sheet throughout Q2 and into Q3:2022 if my expectations are accurate. This may create some additional market volatility in Q2 and Q3:2022 – but I suspect the US Fed will attempt to conduct a lot of this activity relatively quietly – almost behind the market strength/trends.
Q3:2022 Analysis
Q3 shows data that is somewhat similar to Q1 overall. I interpret this data as showing moderate bullish trend strength within the typical mid-Summer US market stagnation in trend. Mid-Summer trends tend to be a bit more sideways in nature. Many traders are vacationing, enjoying the Summer weather, and/or not paying attention to market trends and dynamics. Because of this, I expect the July through September months of 2022 to be relatively quiet and mundane.
Additionally, we have the mid-term US elections set up in November 2022. The July through September months will be packed with political posturing, campaigning, and various events filled with antics to distract the markets from focusing on real issues. As a result, election years tend to be somewhat quiet – especially in the 2 to 5 months leading up to the actual election date.
The end of Q3:2022 and the start of Q4:2022 could see some bigger, more aggressive price trending. The elections, ramping up of the early holiday/Christmas seasons, and the end of Summer may prompt traders to move into undervalued assets or other opportunist trades seeking to ride out an end-of-year trend. Right now may be a great time to identify strong swing/position trades to close out 2022 with some nice profits.
Q4:2022 Analysis
Q4:2022 shows a very strong bullish trend potential, with the POS results greatly surpassing the NEG results. Historically, this is because of the traditional Santa Rally phase of the US markets and may play a big role in 2022 if the US economy stays strong throughout 2022.
Overall, I expect the US Fed to act in a manner that supports the “transitioning” of the global markets away from excessive risks while attempting to nudge inflationary trends lower. There is talk that the US Fed may take aggressive action to combat inflation, but I see the Fed’s actions are more subtle than brutal at this stage.
I believe the US Federal Reserve is keenly aware of the fragility of the global markets after many years of excessive easy-money policies. In my opinion, the current market environment is more similar to the late 1960s and 1970s than the 1990s and early 2000 time frame. We’ve seen a massive influx of capital in the global markets – push all traditional economic metrics “off the charts” after the COVID event. That capital will work itself throughout the global economy, disrupting more at-risk companies and nations’ capabilities, but still prompt a moderate growth component for many years to come.
Volatility, Trading, And Profiting From Bigger Trends
The entire point was to discuss the opportunities of moving above the current excessive price volatility and adopting a trading strategy that is more suited to bigger, broader market price trends. In 2019, I warned that 2020 was likely to be very volatile.
In February 2021, I warned that 2021 was likely to be very volatile for certain market sectors: WILL 2021 PROMPT A BIG ROTATION IN SECTOR TRENDS? – PART II
In early January 2020, I warned the US markets may be set up for a “Waterfall Selloff”: ARE WE SETTING UP FOR A WATERFALL SELLOFF?
Today, I’m suggesting that price volatility will likely peak sometime in 2022 or 2023 and begin to subside as the excesses of the past 8+ years continue to process through what I’m calling the “transitioning phase” of the markets. This market phase is more of a deleveraging and revaluation phase which started in February 2020 – in various sectors. It has now extended into many global economies where excess risk factors are being addressed and revalued (think China, Asia, and other areas).
This transitioning process will likely continue in 2022 and 2023, meaning traders need to be prepared for the increased price volatility and adopt a style of trading that will allow them to profit from these bigger trends. This is why I’m suggesting taking a higher-level approach to trade over the next 24 to 36+ months.
Certain market trends will still allow traders to pick up some fantastic profits as sectors and various undervalued symbols gain momentum. Overall, though, I feel that 2022 and 2023 will be moderately difficult for shorter-term trading strategies and that a higher-level, longer-term approach may be a much more beneficial approach.
Want To Learn More About My Long-Term Investing Strategy?
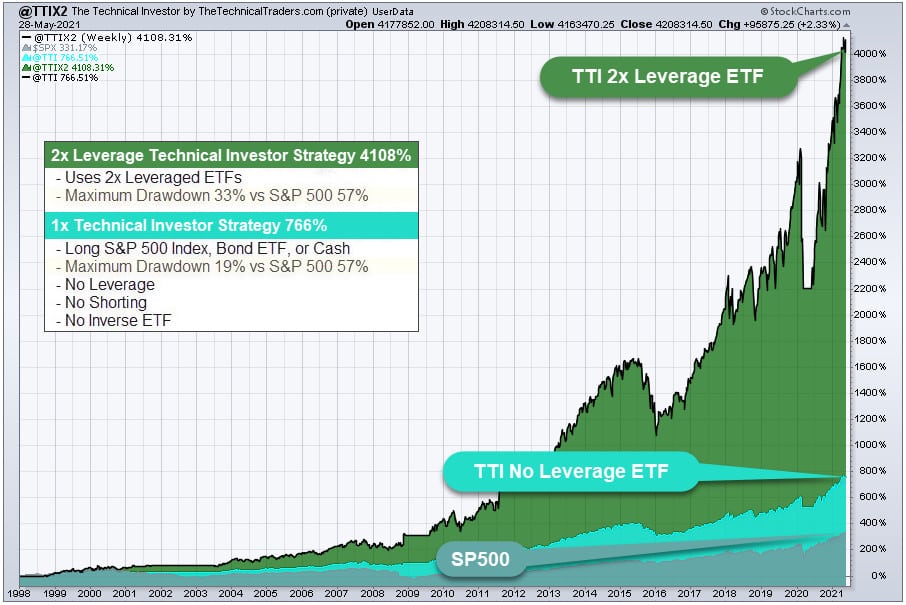
My Technical Investor strategy is uniquely suited toward this type of trading style. It is simple, longer-term, and rises above the moderate price volatility that disrupts many shorter-term trading strategies.
Get ready; 2022 will be an excellent year for traders with big trends and bigger volatility. We have to stay ahead of these trends to protect our capital and allow it to grow more efficiently. The risks of more traditionally moderate volatility systems getting chewed up in this extreme environment will continue. So be prepared to move towards a more protective trading style to survive the next 12 to 24 months.
If you are interested in learning more about how my Technical Investor (and other trading strategies) can help you protect and grow your wealth in any type of market condition, I invite you to visit www.TheTechnicalTraders.com
Chris Vermeulen
Founder of Technical Traders Ltd.